
Graphing Digital Assets
Month in Review — August 2025
AltCoin Season?
August marked a striking divergence within digital assets: as bitcoin declined more than 6% in the month, a wave of capital rotated into altcoins, fueling what may be the beginning of the next “altcoin season” (Figure 1). The move away from BTC continued into September. Ethereum gained 18.73% in August, with an additional 1.90% through September, buoyed by renewed demand for ETH-based staking strategies and anticipation of broader Layer-2 scaling adoption. Chainlink was the standout, advancing more than 37% on rising oracle demand and an additional 7.20% through September. Solana was close behind, surging 16.69%, supported by expanding DeFi activity and network throughput improvements, with another 16.15% as of this writing in September.
The gains translated into relative outperformance versus bitcoin at the index level. In contrast to BTC losses, the FTSE Digital Asset SMID Index returned 11.07% in August, while the Bitwise 10 ex Bitcoin Crypto Index returned 9.62%, a sharp reversal from the bitcoin-led rallies of prior months. Trading activity reinforced the trend: ETH and SOL perpetual futures volumes surged to year-to-date highs, while BTC derivatives cooled, signaling institutional re-positioning toward majors outside of bitcoin. Market share metrics echoed this: bitcoin dominance slipped, while ether’s share of total market capitalization edged higher. ETF flows further amplified the rally, with ETH products attracting fresh capital against a backdrop of easing macro conditions and optimistic price forecasts (Figure 2).
Seasonality also played a role. August and September have historically been periods where bitcoin underperforms, averaging negative returns since 2013, while periods of strength in ETH during August have often been followed by a weaker September with constructive momentum in subsequent months. Although not predictive, this backdrop contextualizes the current rotation: thin liquidity and post-summer repositioning can magnify relative moves, allowing altcoins with credible growth narratives to capture asymmetric flows.
For allocators, the divergence highlights the importance of diversification beyond bitcoin. Market leadership rotates and, in environments where BTC consolidates, majors such as ETH, SOL, and LINK can provide differentiated exposure and upside aligned with network adoption and on-chain growth.
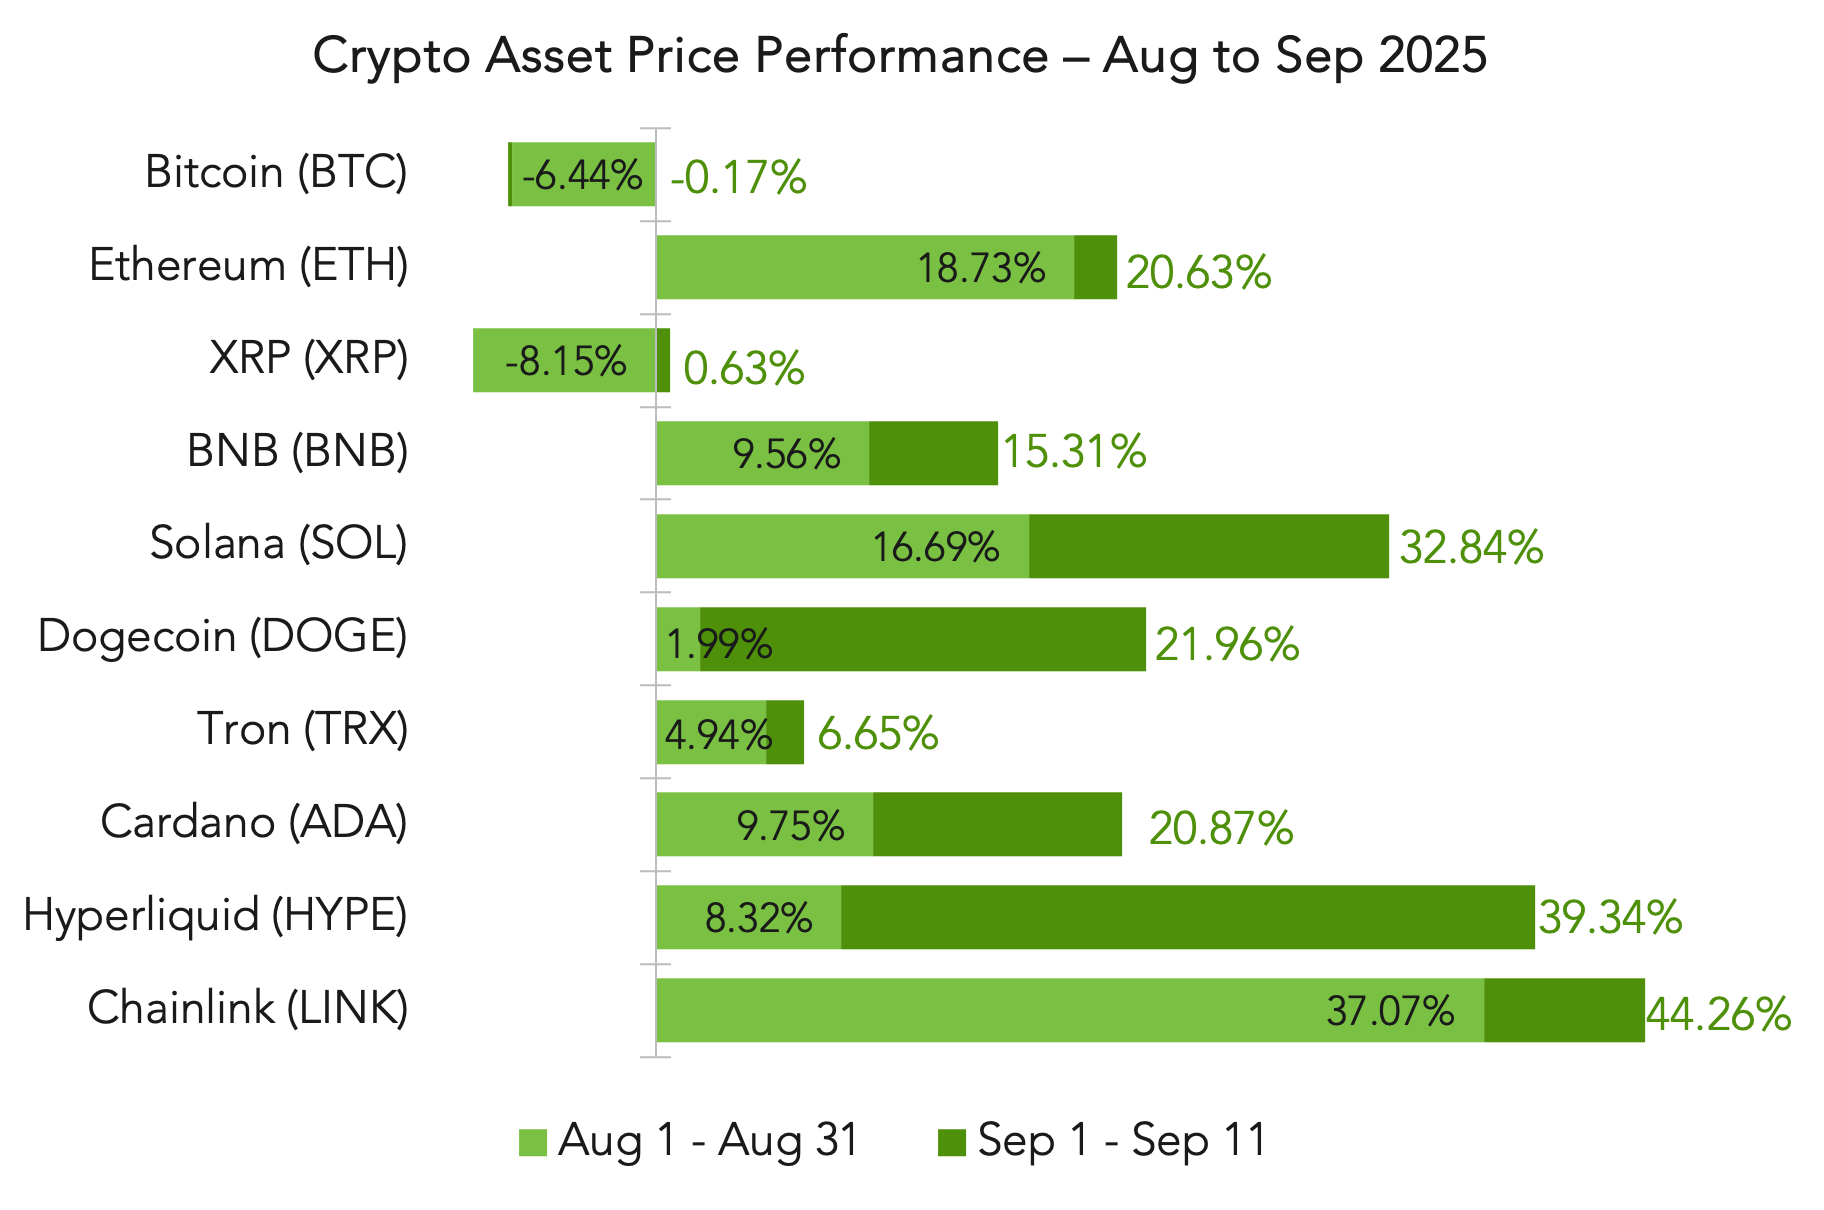
Figure 1
Source: Coingecko as of September 11, 2025, close, beginning July 31, 2025, close. Numbers shown represent August 1, 2025, through August 31, 2025 (black font), and total change from August 1, 2025, to September 11, 2025 (green font).

Figure 2
Source: Coinglass. Data accessed September 12, 2025.
Corporate digital-asset treasuries expanded materially in 2025, with public-company bitcoin balances crossing the 1,000,000 BTC threshold in early September. Ether treasuries also became a visible sub-segment. While holdings remain concentrated, the pipeline continues to widen, putting more scrutiny on how each balance sheet translates equity dollars into coin-per-share growth.
The announcement effect in August was consistent with history: initiation headlines still delivered the sharpest price and volume responses, while follow-on raises and policy tweaks were absorbed more through financing math and dilution risk (Figure 3). Tom Lee’s June appointment as BitMine chair and its ETH treasury plan drove heavy trading and a sharp rerating, while Strategy’s steady weekly disclosures provided transparency but far less dramatic impact. Upexi’s April 21 SOL plan similarly sparked a brief triple-digit spike before retracing as financing terms became clearer.
Premiums also tightened. The NAV multiple captures how much equity markets pay above the coins themselves, reflecting expectations for discipline and operating leverage. As Figure 4 shows, multiples have compressed materially from prior peaks. The implication is straightforward: token accumulation alone no longer guarantees elevated valuations. Instead, equity performance is driven by execution quality—sustainable per-share coin growth, measured use of financing, and transparent capital policy.
Bottom line: through August month-end, corporate treasuries grew in value and breadth, and initiation announcements continued to re-rate shares. But with tighter premia, the long-term playbook has shifted. Equity value now depends less on simply holding tokens and more on how effectively companies manage those assets through disciplined issuance, efficient balance-sheet design, and clear disclosures.
Beyond the Balance Sheet: Rethinking Value in DATs

Figure 3
Source: Yahoo Finance as of September 11, 2025, close.
MSTR BTC acquisitions result in decreasing stock pops into 2025:
A) Nov 11, 2024: added 27,200 BTC. | B) Nov 25, 2024: added 55,500 BTC. | C) May 25, 2025: added 4,020 BTC. | D) Jun 30, 2025: added 4,980 BTC. | E) Jul 29, 2025: added 21,021 BTC. | F) Aug 25, 2025: added 3,081 BTC.
BMNR ETH acquisitions result in decreasing stock pops following initial announcement:
G) Jun 30, 2025: Launch. | H) Jul 8, 2025: initial acquisition of 833,000 ETH. | I) Jul 29, 2025: disclosed 625,000 ETH. | J) Aug 18, 2025: added 373,000 ETH. | K) Sep 8, 2025: announced total holdings of 2,069,443 ETH.

Figure 4
Source: bitcointreasuries.net. Includes top 4 companies with bitcoin treasury holdings prior to 2025.
The Fed’s Dilemma
As the market braces for the results of the FOMC’s next meeting on September 16, we review some of the conditions that will likely affect the decision regarding anticipated rate cuts.
The U.S. labor market has softened. August’s payroll report showed just 22,000 jobs added, far below consensus, with prior months revised lower. The unemployment rate ticked up to 4.3%, and weekly jobless claims continue to edge higher (Figure 5). What had been a gradual cooling in 2024 has accelerated into clear weakness this summer.
Meanwhile, inflation remains sticky. The August CPI release showed headline prices up 2.9% year-over-year, and core CPI at 3.1% (Figure 6). Headline CPI reflects the full basket of goods and services, including volatile food and energy, and core CPI strips those out to highlight underlying trends like shelter and services. While headline captures the costs households actually feel day to day, core offers policymakers a clearer view of whether inflation pressures are temporary swings in energy and food or signs of persistent, broad-based price growth; therefore, the Fed often places more weight on core because it signals persistent inflation pressures. In August, housing costs drove much of the increase, with energy contributing a notable rebound.
For policymakers, this combination of weakening jobs data alongside above-target inflation complicates the September-meeting decision. Markets, however, have already priced in a 25-basis-point cut, the first step of a potential easing cycle. Whether it proves to be the start of a broader path or a one-off insurance move remains uncertain.
Herein lies the Fed’s dilemma. Typically, elevated inflation argues against cutting rates. The combination of soft jobs data and above-target prices presents a difficult trade-off as the Fed faces pressure from both the administration and major financial institutions to move more aggressively on rate cuts.
For digital assets, the macro backdrop may once again be a key driver. Risk assets have responded less to crypto-specific developments and more to the path of rates and the dollar. Easing conditions could support flows, but sticky inflation may limit how far the Fed can go.
Bottom line: The September Fed meeting will set the tone for the next quarter. With jobs data flashing caution and inflation still elevated, investors across asset classes should brace for a policy path more complicated than a simple “cut and done.”

Figure 5
Source: U.S. Bureau of Labor Statistics as of August 31, 2025.
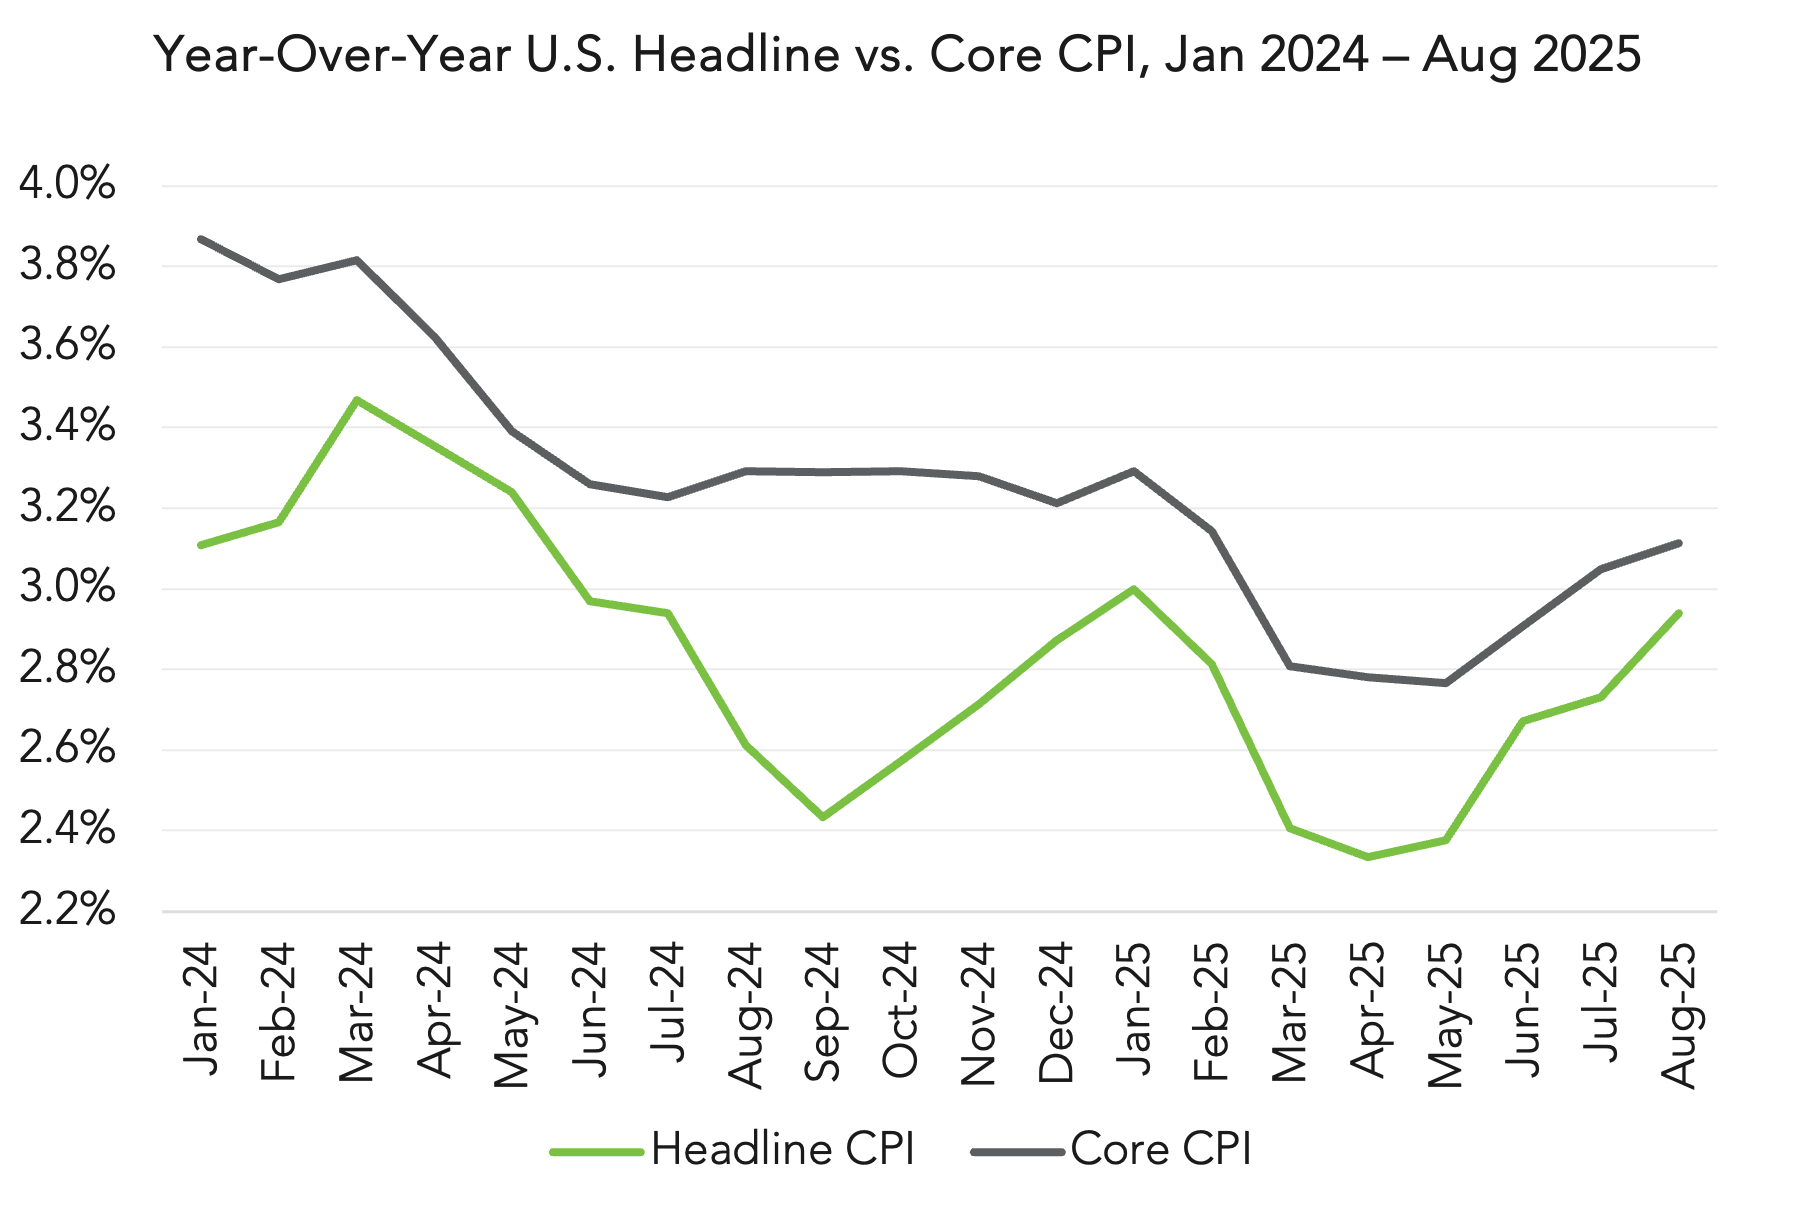
Figure 6
Source: Federal Reserve Bank of St. Louis as of August 31, 2025.