
Graphing Digital Assets
Month in Review — January 2026
January delivered sharp and uneven price action across asset classes, revealing a market increasingly sensitive to shifts in liquidity expectations rather than changes in underlying fundamentals. Assets traditionally viewed as defensive exhibited outsized volatility, while risk assets responded selectively rather than uniformly.
Bitcoin and ether declined through the month, underperforming both precious metals and broad equity indices (Figure 1). The move contrasted with expectations entering the year that crypto would continue to benefit from improving sentiment and institutional participation. Instead, price action reflected a repricing driven by macro constraints rather than asset-specific weakness.
Several developments shaped this shift. The Federal Reserve held rates steady at its January 28 meeting, reinforcing a cautious stance and offering little indication of imminent easing. Two days later, the announcement nominating Kevin Warsh to succeed Chair Powell altered expectations around balance-sheet policy and monetary discipline. His emphasis on monetary restraint prompted markets to reassess the pace of future liquidity expansion.
That reassessment echoed discussions taking place at the World Economic Forum in Davos, centered on fiscal constraints, uneven global growth, and the difficulty of sustaining disinflation. The tone contrasted with earlier assumptions of synchronized global easing and contributed to a broader recalibration of risk appetite.
The impact was visible across markets. Equities absorbed the shift with dispersion rather than broad de-risking, particularly within large-cap technology. The Magnificent 7, for instance, did not trade as a single factor, reflecting differences in valuation, earnings sensitivity, and rate exposure. Precious metals behaved even more unexpectedly: gold extended gains, while silver experienced extreme intraday swings, including sharp single-day reversals more commonly associated with high-beta assets (Figure 1).
These dynamics fed directly into bitcoin price expectations (Figure 2). While long-term upside targets largely remained intact, sentiment shifted toward wider outcome ranges amid macro and liquidity uncertainty. Standard Chartered slashed its previous year-end 2026 forecast of $300,000 to $150,000, and delayed its $500,000 long-term projection to 2030, emphasizing that realization depends on renewed liquidity and sustained ETF inflows rather than cycle momentum alone. Bernstein, however, maintained its $150,000 target, characterizing the recent drawdown as a “crisis of confidence” rather than a structural break. Bernstein’s long-term outlook forecasts Bitcoin reaching $200,000 by the end of 2027 and up to $1,000,000 by 2033. In parallel, model-driven forecasts published in January reflected the recalibration by expanding the min-max forecast range and flattening near-term trajectories, signaling uncertainty around timing even as longer-horizon expectations remained upward-biased.
Historically, bitcoin has exceeded expert price targets over full cycles, but rarely without sharp interim volatility. January’s price action fit that pattern, resetting expectations around the path and timing.
Patchy Price Predictability
Figure 1
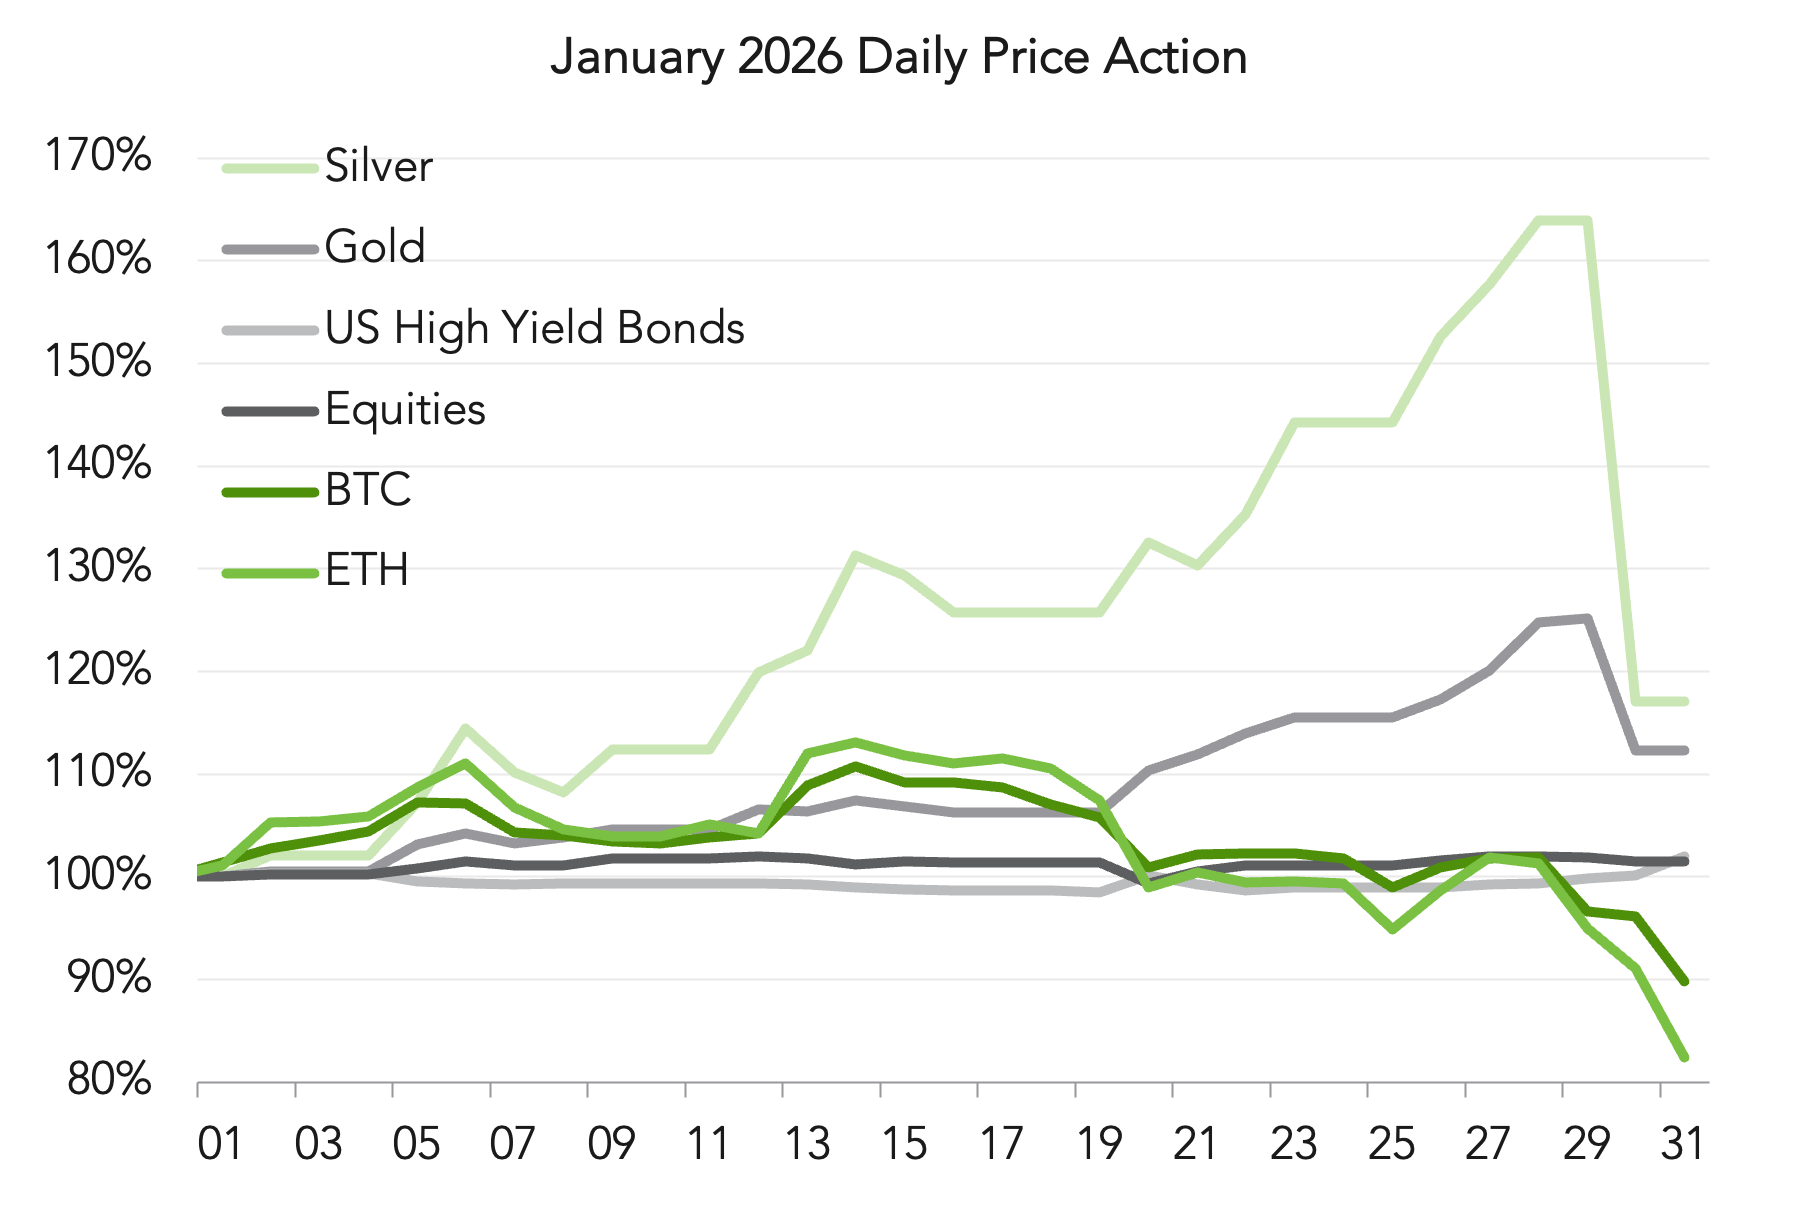
Daily performance from January 1 to January 31, 2026. Sources: iShares Silver Trust (SLV); SPDR Gold Trust (GLD); ICE BofA US High Yield Index Effective Yield sourced from FRED; S&P Global - S&P 500 TR Index; BTC and ETH price from Yahoo Finance.
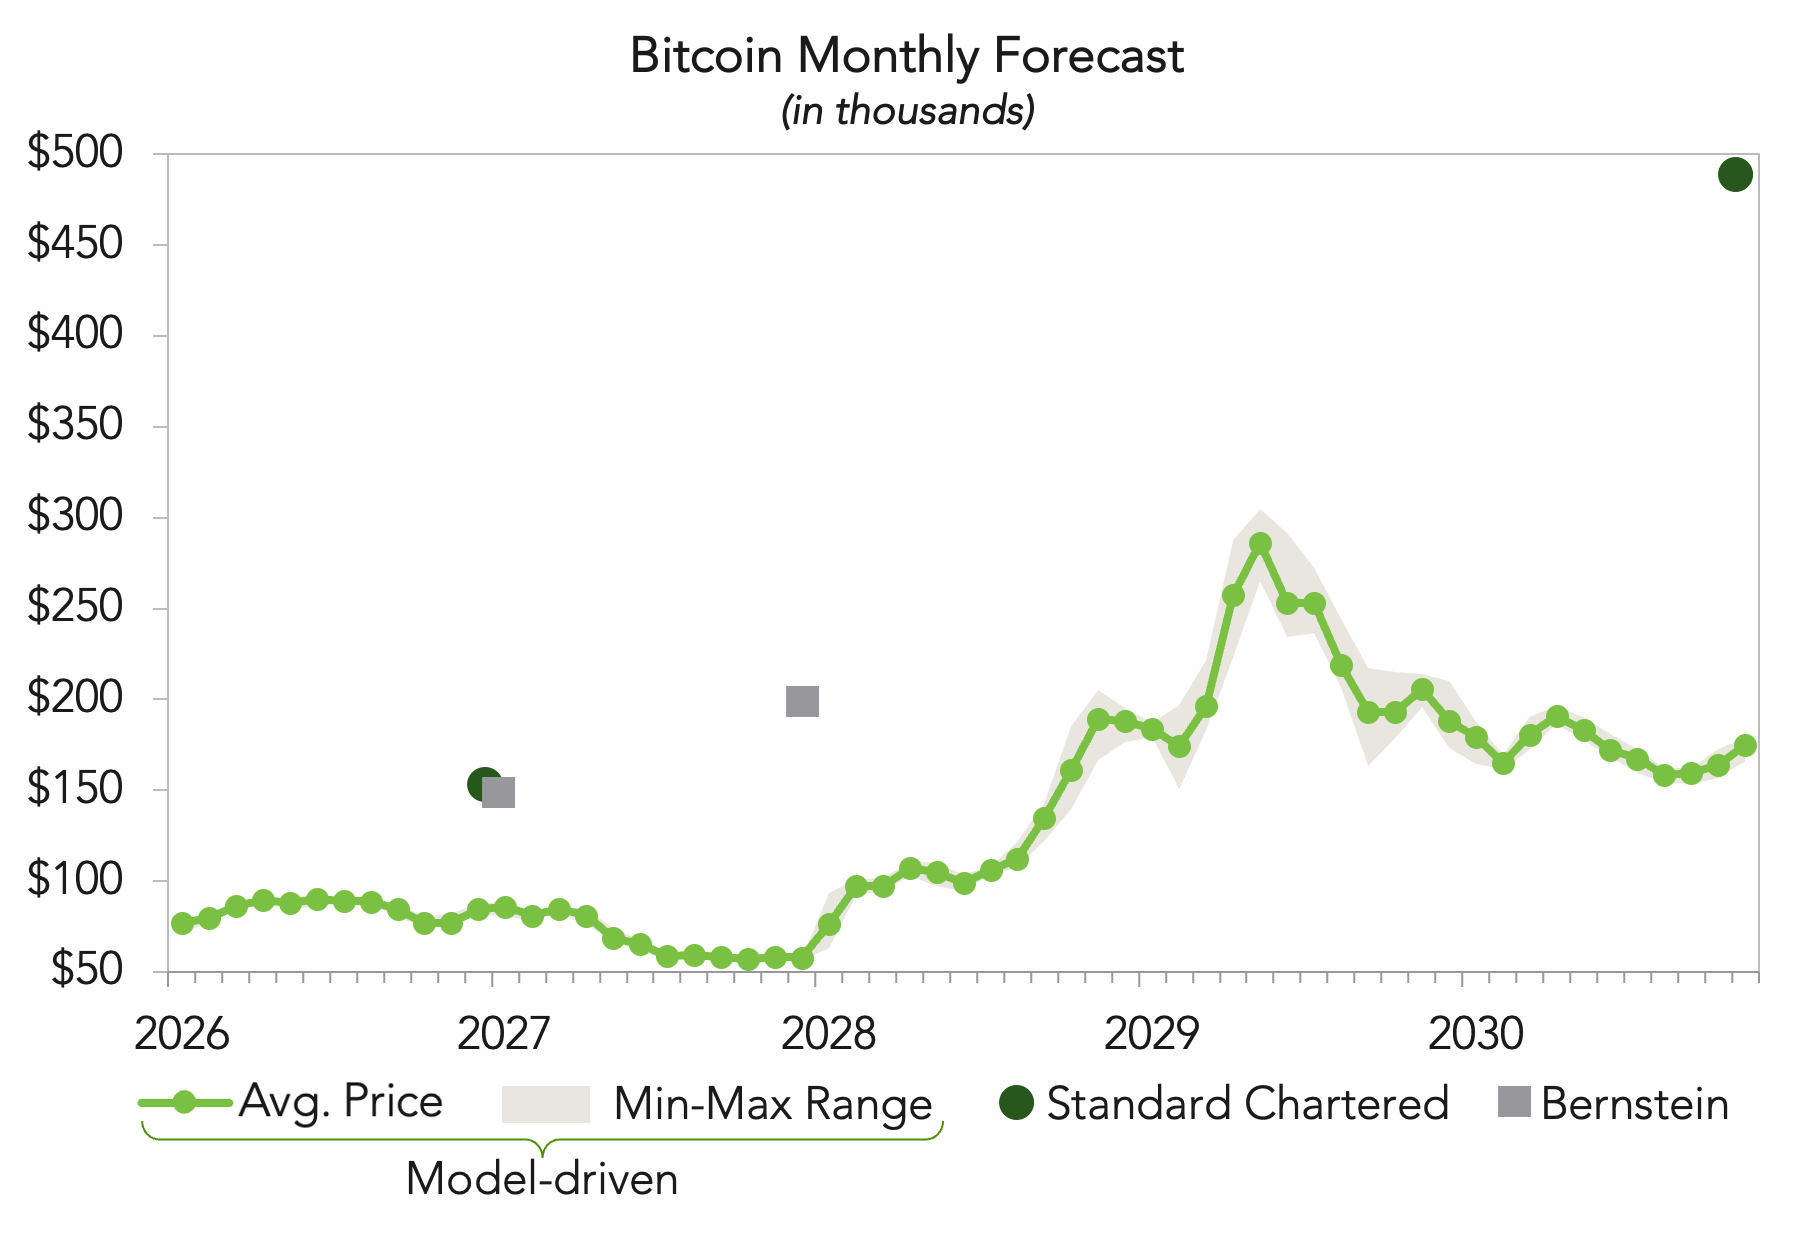
Figure 2
Sources: Model-driven prediction from https://coincodex.com/crypto/bitcoin/price-prediction/; data retrieved February 5, 2026. Samara Alpha Management, Bloomberg, The Block.
January was expected to bring forward momentum on U.S. digital asset market structure. Instead, the CLARITY Act became a real-time study in the competing interests shaping crypto regulation: crypto-native firms pushing for scalable, onchain-compatible rules vs. financial institutions seeking tighter perimeter controls as crypto infrastructure moves closer to the banking system.
The bill’s original intent was clear: define jurisdiction between the SEC and CFTC, establish registration pathways for trading venues, and replace regulation-by-enforcement with statutory rules. That framework initially aligned with institutional priorities, particularly as traditional finance expands tokenized payment, settlement, and custody infrastructure.
Senate revisions shifted focus to stablecoins. Bank trade groups pushed to close what they described as an “interest loophole,” arguing that allowing stablecoin yield (directly or indirectly) could draw deposits away from the banking system and constrain lending capacity. Crypto firms countered that restricting rewards would be anti-competitive, protecting bank margins rather than consumers, especially as retail deposit rates have often lagged policy rates. The dispute became central enough to stall legislative momentum and fracture industry alignment. Coinbase CEO, Brian Armstrong, publicly withdrew support, arguing the revised bill was worse than no legislation at all. His reversal underscored how far the updated draft had moved toward bank-friendly outcomes at the expense of crypto-native business models.
The debate highlighted a broader reality embedded in the bill’s evolution. Market structure is not neutral. Rules governing registration thresholds, custody, stablecoin economics, and onchain activity can either widen access or concentrate activity among institutions already operating at scale (Figure 1). Accelerated initiatives by major players, such as Fidelity’s launch of an ETH-based stablecoin and JP Morgan’s Kinexys, raise the stakes of how U.S. market structure ultimately takes shape.
Efforts to bridge the divide extended beyond Congress, with a closed-door meeting hosted by Donald Trump on February 2 bringing together banking and crypto industry representatives, but failing to resolve the core disagreement over stablecoin provisions. (A second closed-door summit is being held on February 10.)
Despite actual legislative progress, market expectations have shifted materially. Polymarket’s implied probability of the CLARITY Act passing in 2026 fell to a low of 39% in January, rebounding to 72% on February 4 (Figure 2). That volatility reflects the bill’s central challenge: can institutional risk controls and crypto-native innovation be reconciled within a single U.S. market-structure framework?
CLARITY Act Remains Unclear
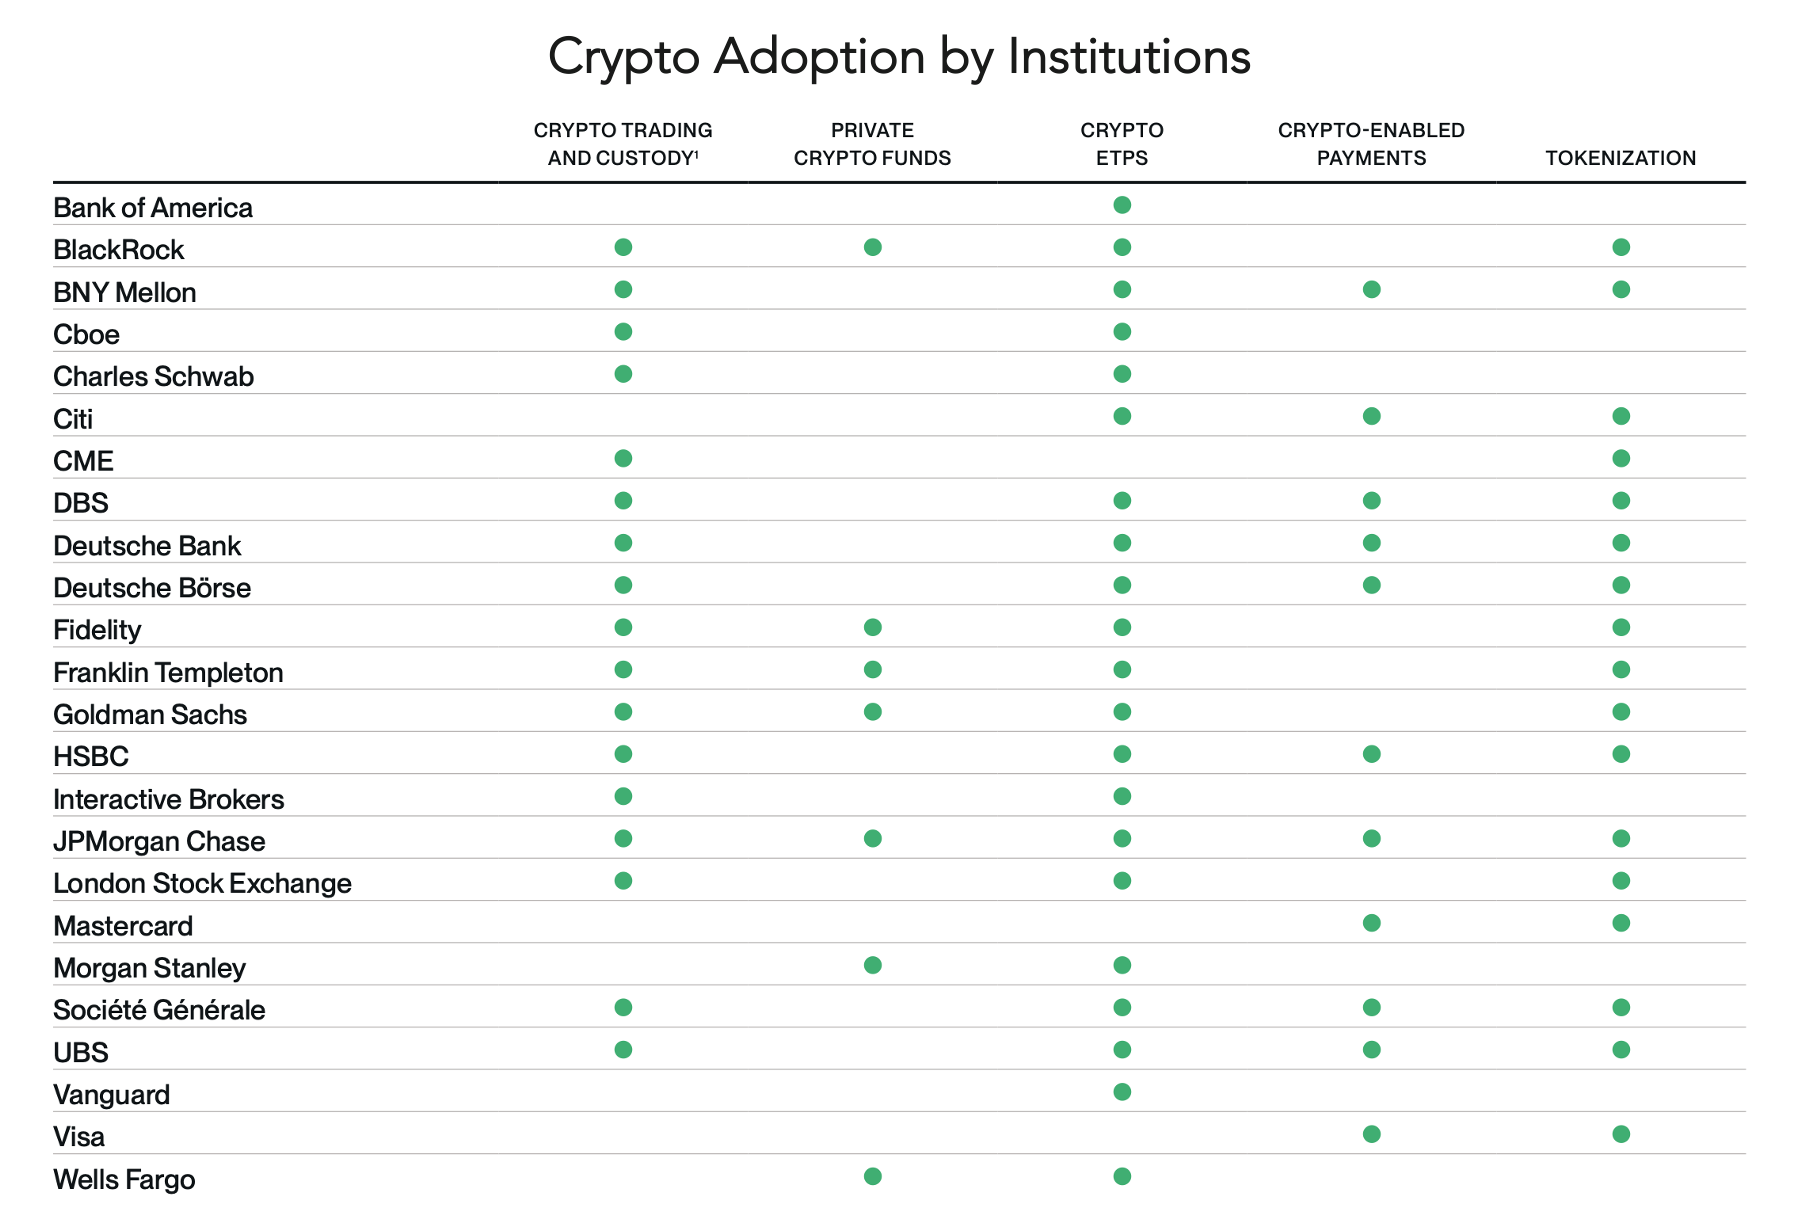
Figure 3
Source: ”Bitwise Crypto Market Review” – Bitwise Asset Management with data from company filings and presentations. Data as of December 31, 2025. (1) Includes the trading of crypto spot, futures, and derivatives products.
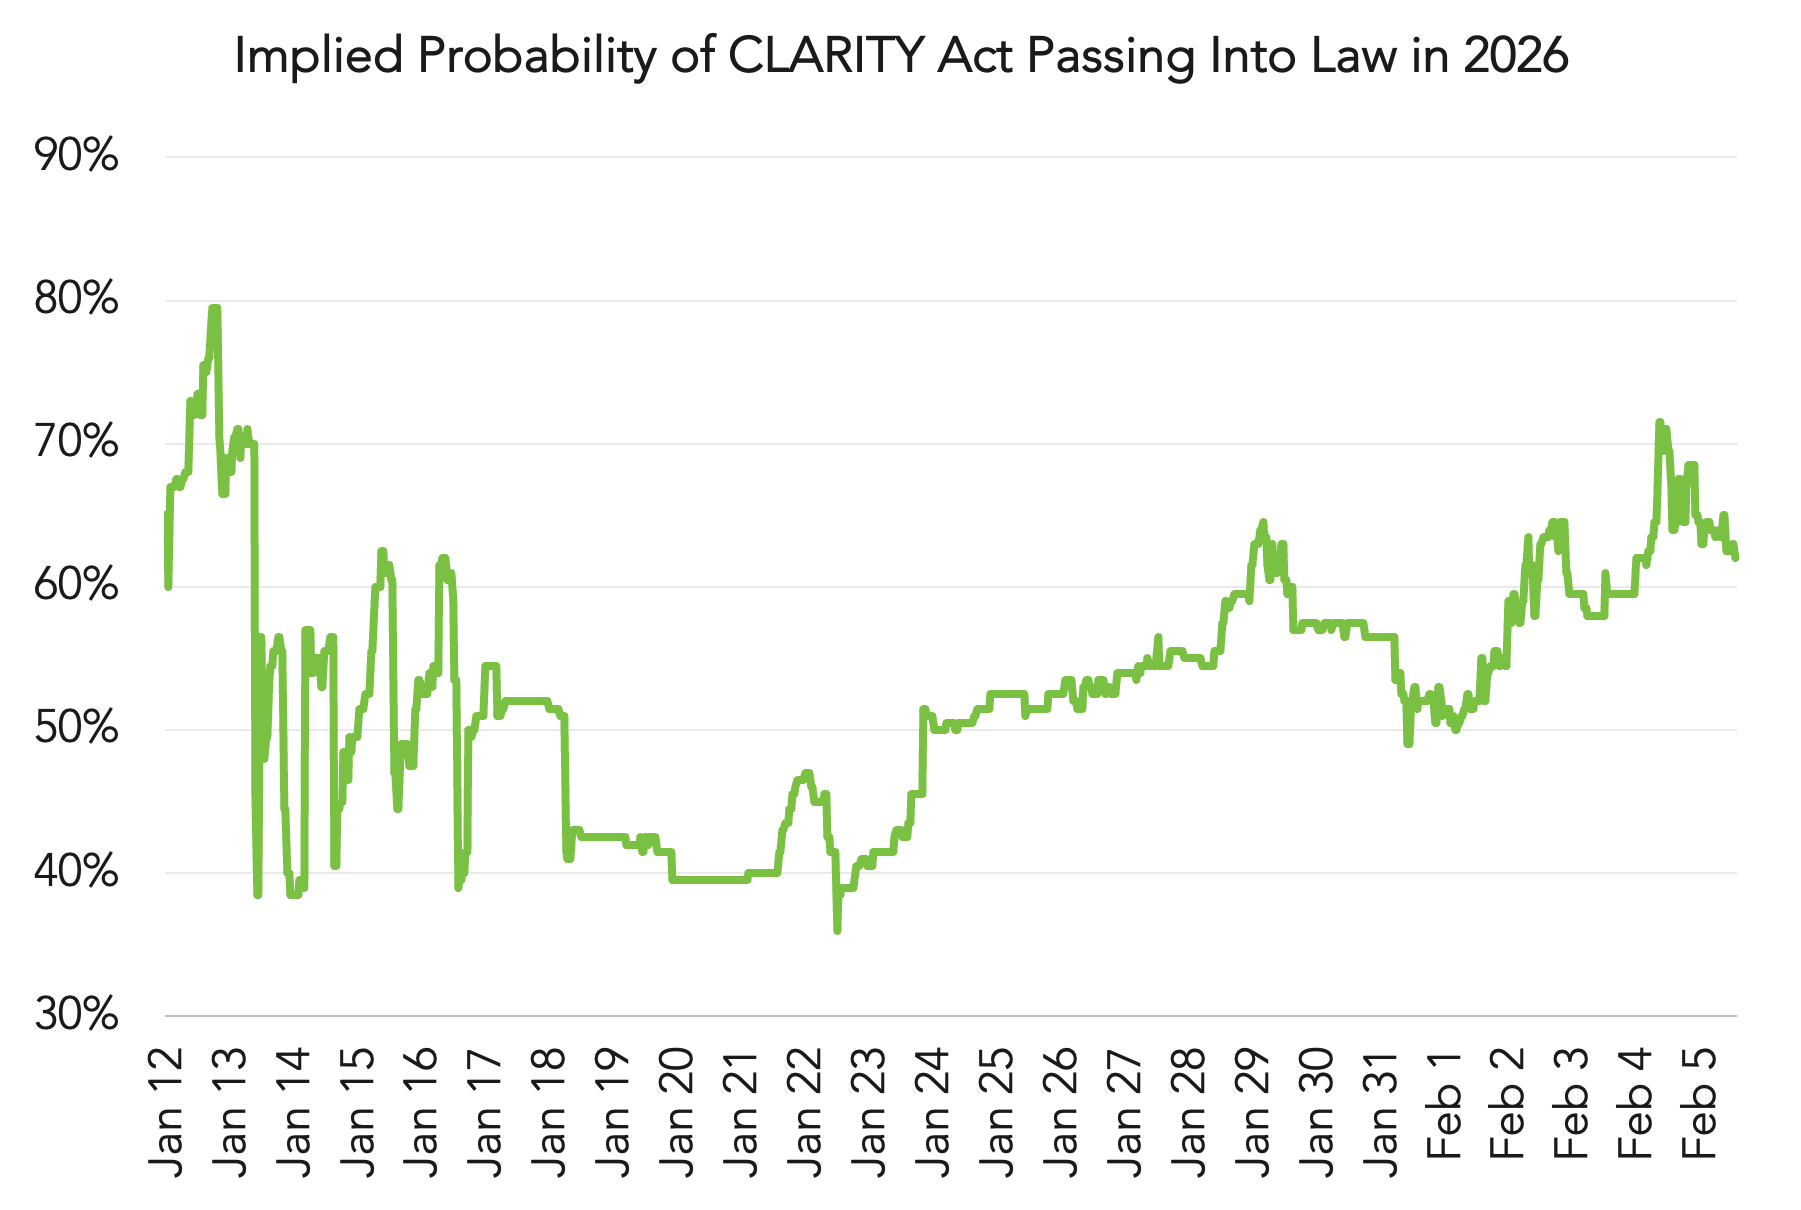
Figure 4
Source: https://polymarket.com/event/clarity-act-signed-into-law-in-2026; data retrieved February 4, 2026.
Return dispersion remained a defining feature of digital asset markets in 2025 and carried into January 2026. As evidenced in Figure 5, outcomes varied across crypto strategies, with meaningful differences between passive exposure, directional approaches, and more defensive structures. Median returns clustered near zero for many strategies, while averages were pulled higher or lower by outliers, underscoring how volatility, rather than trend, dominated results.
That dispersion became more pronounced in January 2026 (Figure 6). While direct investing in bitcoin would have generated a loss of more than 10% in the month, hedge fund investing may have softened the blow, even as performance across certain hedge fund strategies diverged. Directional digital asset indices exhibited deeper drawdowns, while multi-strategy and long/short approaches showed comparatively muted declines. In contrast, traditional hedge fund indices, particularly macro and equity hedge strategies, posted positive returns, highlighting that January was not a broad hedge fund drawdown, but a crypto-specific repricing event.
The data reinforces an important distinction. Crypto hedge fund performance was not driven solely by market direction, but by how exposure was constructed and managed. Even within digital asset strategies, outcomes differed meaningfully, reflecting variation in net exposure, volatility management, and implementation. The gap between bitcoin’s January decline and the narrower range of returns across certain hedge fund indices illustrates how execution and risk controls influenced results during a volatile period.
This environment is precisely where market-neutral and relative-value approaches are designed to operate. Properly managed market-neutral strategies seek to capitalize on dispersion, funding differentials, and volatility rather than rely on price appreciation. As evidenced by Samara Alpha’s own BTC-denominated fund, well-constructed digital asset portfolios demonstrated greater resilience, outperforming most competitors during periods of elevated volatility.
From an allocator perspective, the takeaway is structural. Digital asset hedge funds cannot be evaluated as a single category. Dispersion across strategies—and even within strategy labels—remains wide, particularly during macro-driven repricing. Periods like January reinforce that manager selection, portfolio construction, and risk discipline continue to be primary drivers of outcomes in digital asset hedge fund allocations.
Performance Dispersion Dynamics
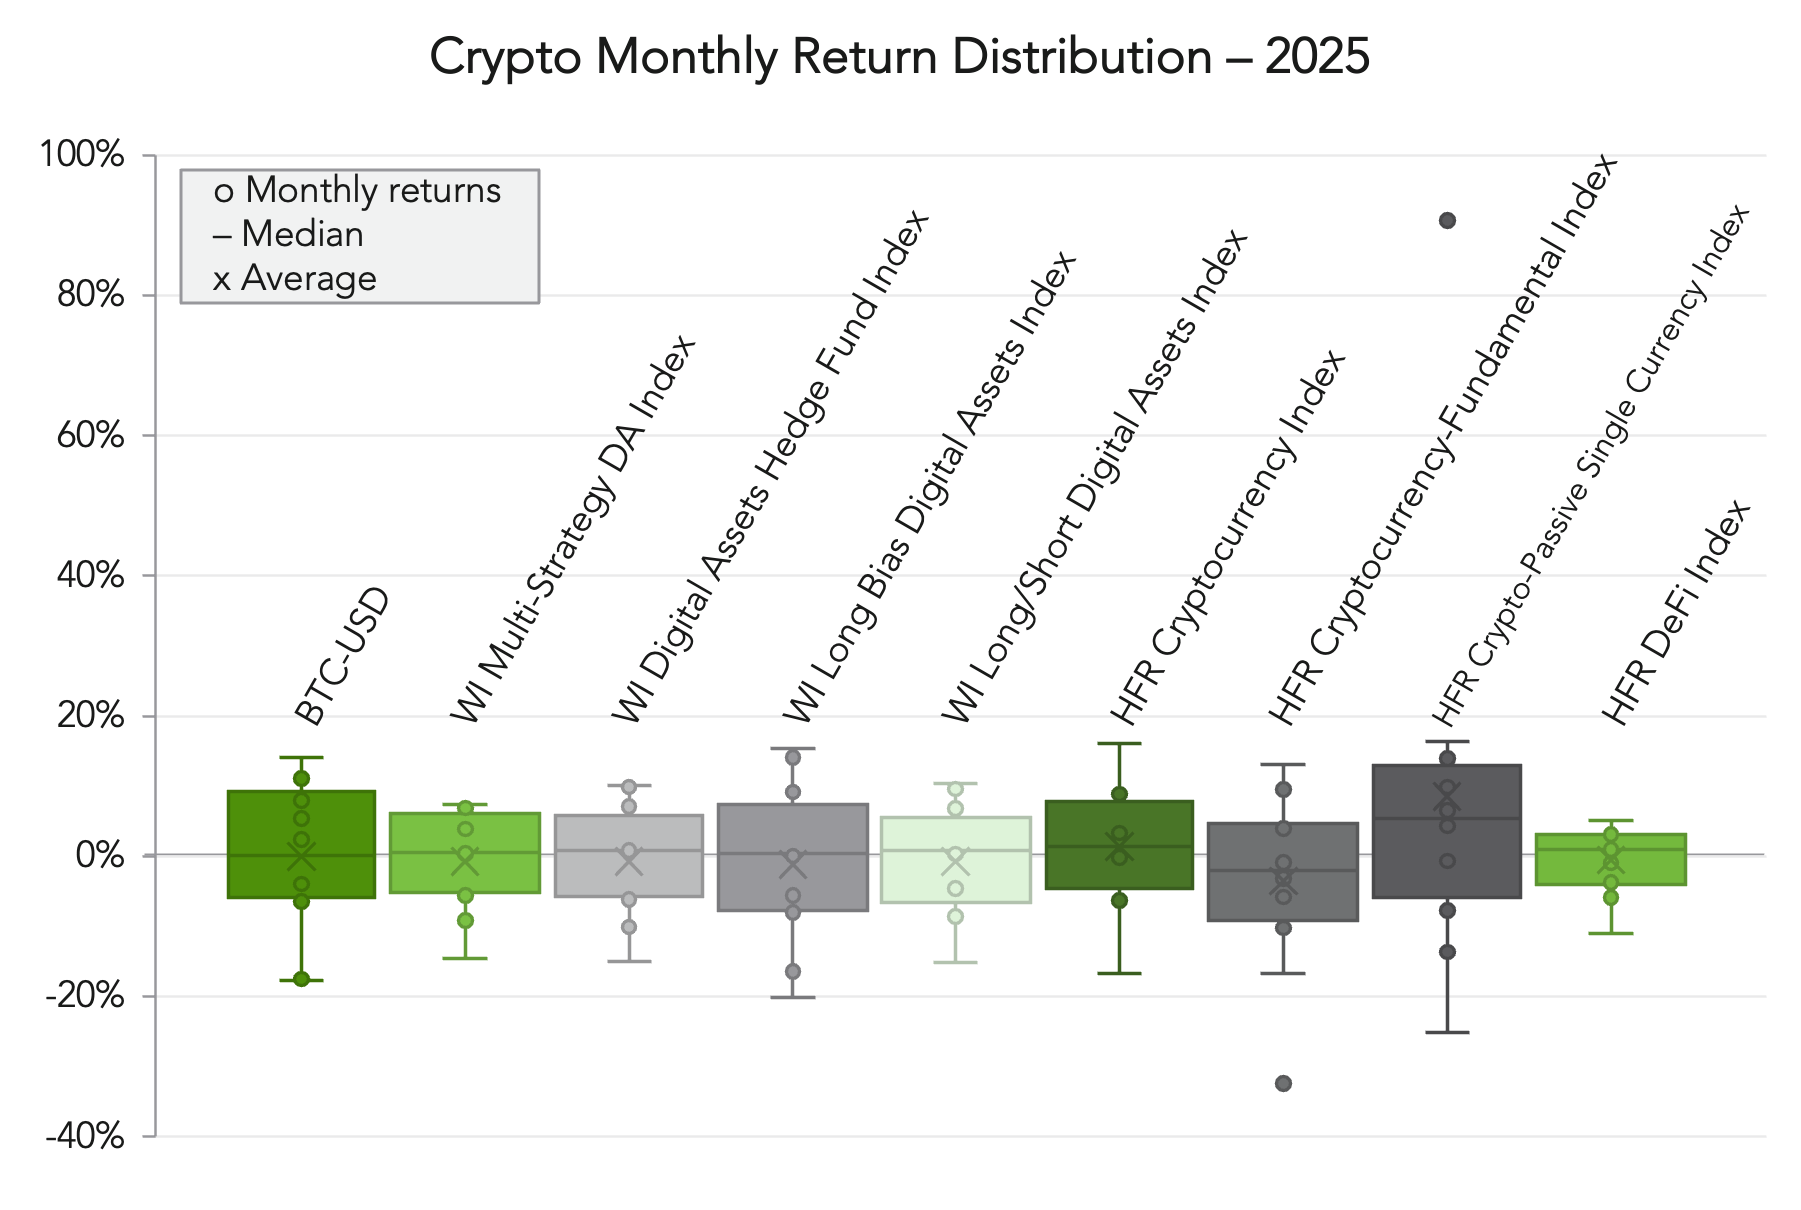
Figure 5
Data as of December 31, 2025, most recent common data available. Sources: BTC price from Coinbase; With Intelligence Index data from https://platform.withintelligence.com/performance/indices; HFR Index data from https://www.hfr.com/indices/.
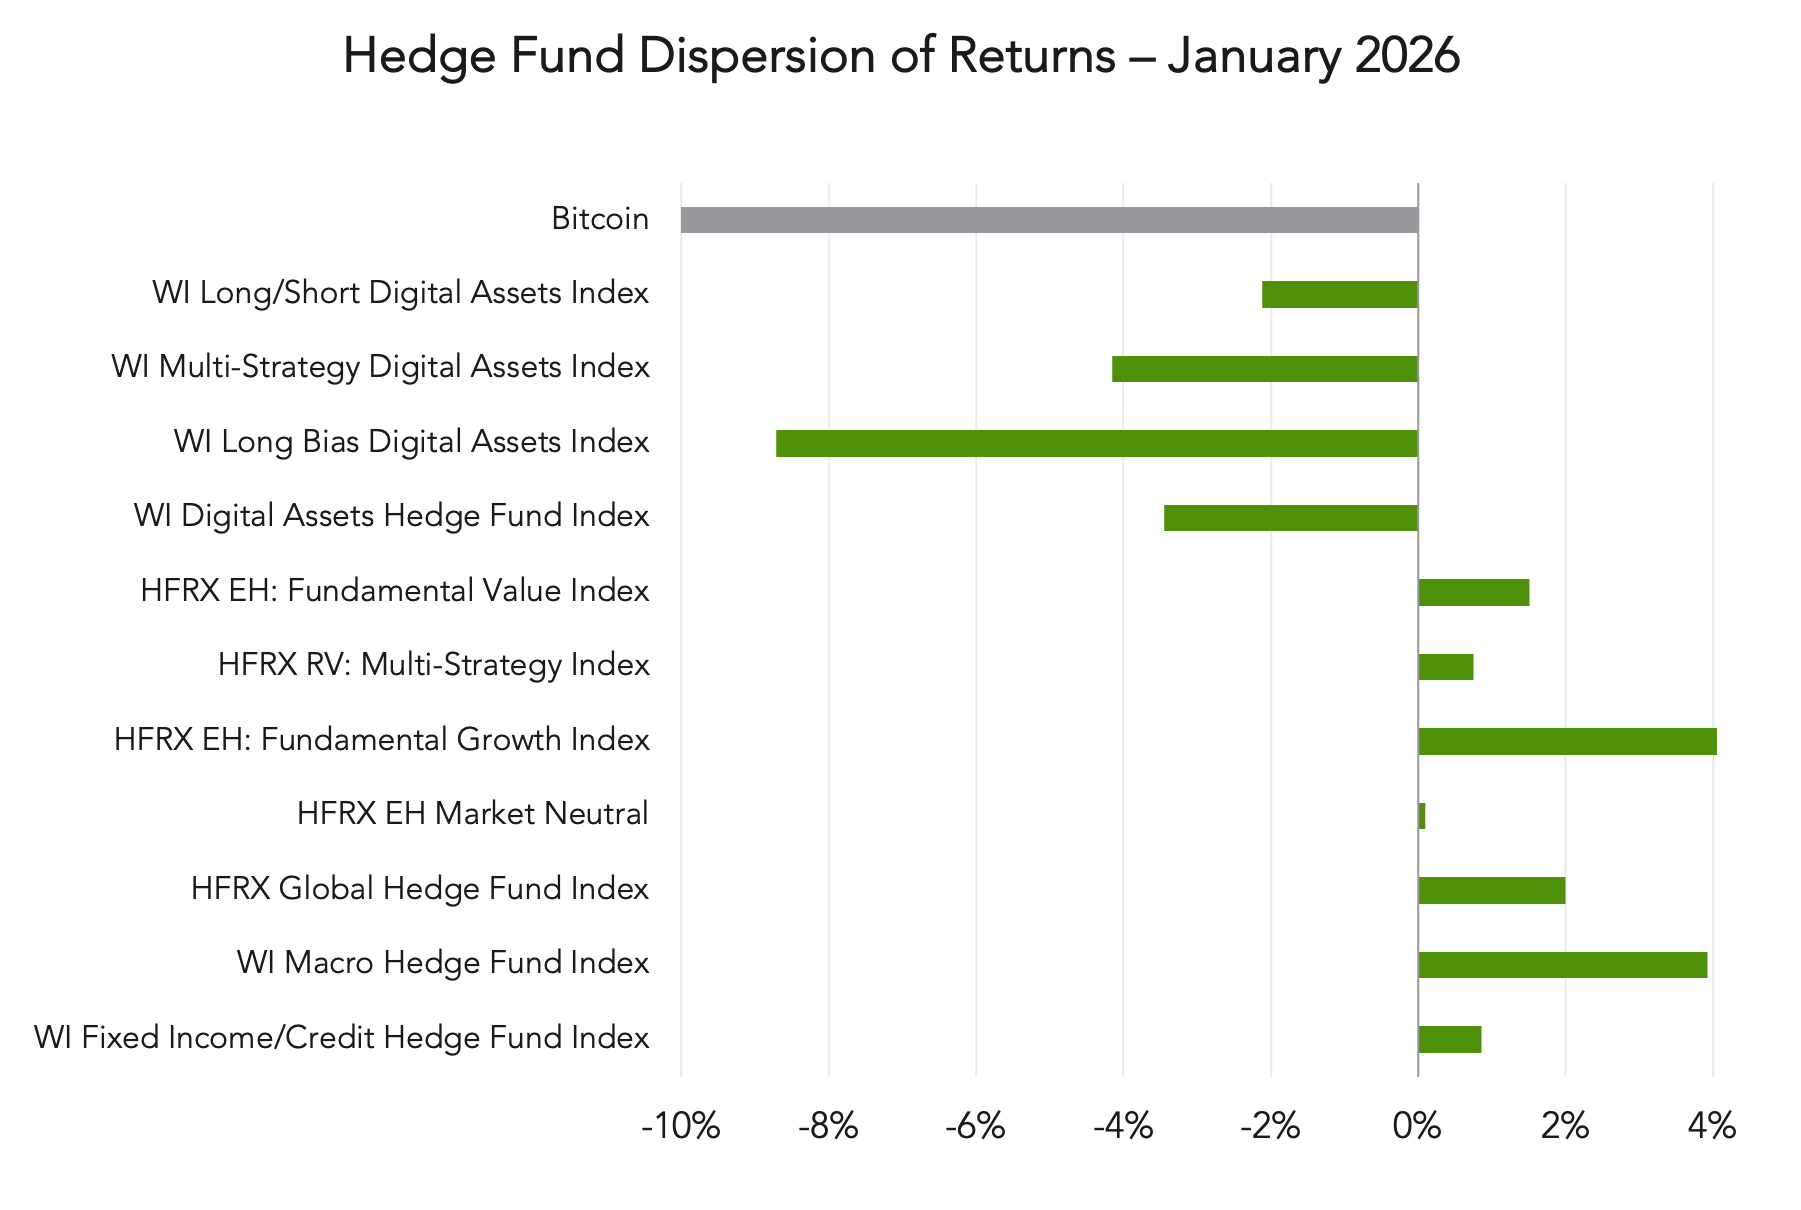
Figure 6
Sources: With Intelligence Index data from https://platform.withintelligence.com/performance/indices; HFR Index data from https://www.hfr.com/indices/. As of January 31, 2026.