
Graphing Digital Assets
Month in Review — October 2025
On October 10, digital asset markets experienced their sharpest single-day liquidation in history: nearly $19.4 billion in leveraged positions erased within hours, ten times the magnitude of the largest FTX-era event. The cascade was concentrated across major centralized exchanges (Figure 1), with roughly 87% long positions, underscoring how overextended the market had become.
The unwind began with renewed U.S.-China tariff headlines sparking a sharp risk-off move that reverberated across global assets. In crypto, automated liquidation engines amplified the sell-off as collateral values fell and margin calls were triggered across exchanges.
Adding to the turmoil, Binance confirmed that a malfunction in one of its price-feed oracles delayed automatic liquidation halts for certain futures contracts. The exchange later acknowledged the error and reimbursed approximately $283 million in client losses within 24 hours, a timely intervention that prevented broader contagion. Within hours, margin logic was restored and normal operations resumed, an outcome unlikely in prior drawdowns. The episode illustrated that operational maturity, not speculation, now guides market recovery.
Concurrently, spot bitcoin ETFs absorbed volatility rather than amplifying it (Figure 2). Despite the magnitude of intraday sell-off, spot BTC ETF flows remained net-positive for the month (+$3.4 billion), suggesting institutional allocators treated the drawdown as a transient liquidity event rather than a structural failure. That behavior contrasts sharply with earlier cycles, when leveraged liquidations often cascaded into forced fund redemptions.
Taken together, October’s “Crypto Black Friday” became a real-world stress test that the ecosystem largely passed. Leverage remains a feature of crypto markets, and price swings may still be sharp, but the market’s plumbing has improved dramatically. Exchange-level accountability, better margin logic, and the steady presence of regulated investment vehicles helped contain systemic risk.
The result wasn’t immunity from volatility, but resilience in the face of it – a market that bends without breaking, capable of digesting shock while retaining institutional confidence.
Crypto Black Friday: Lessons in Leverage and Resilience
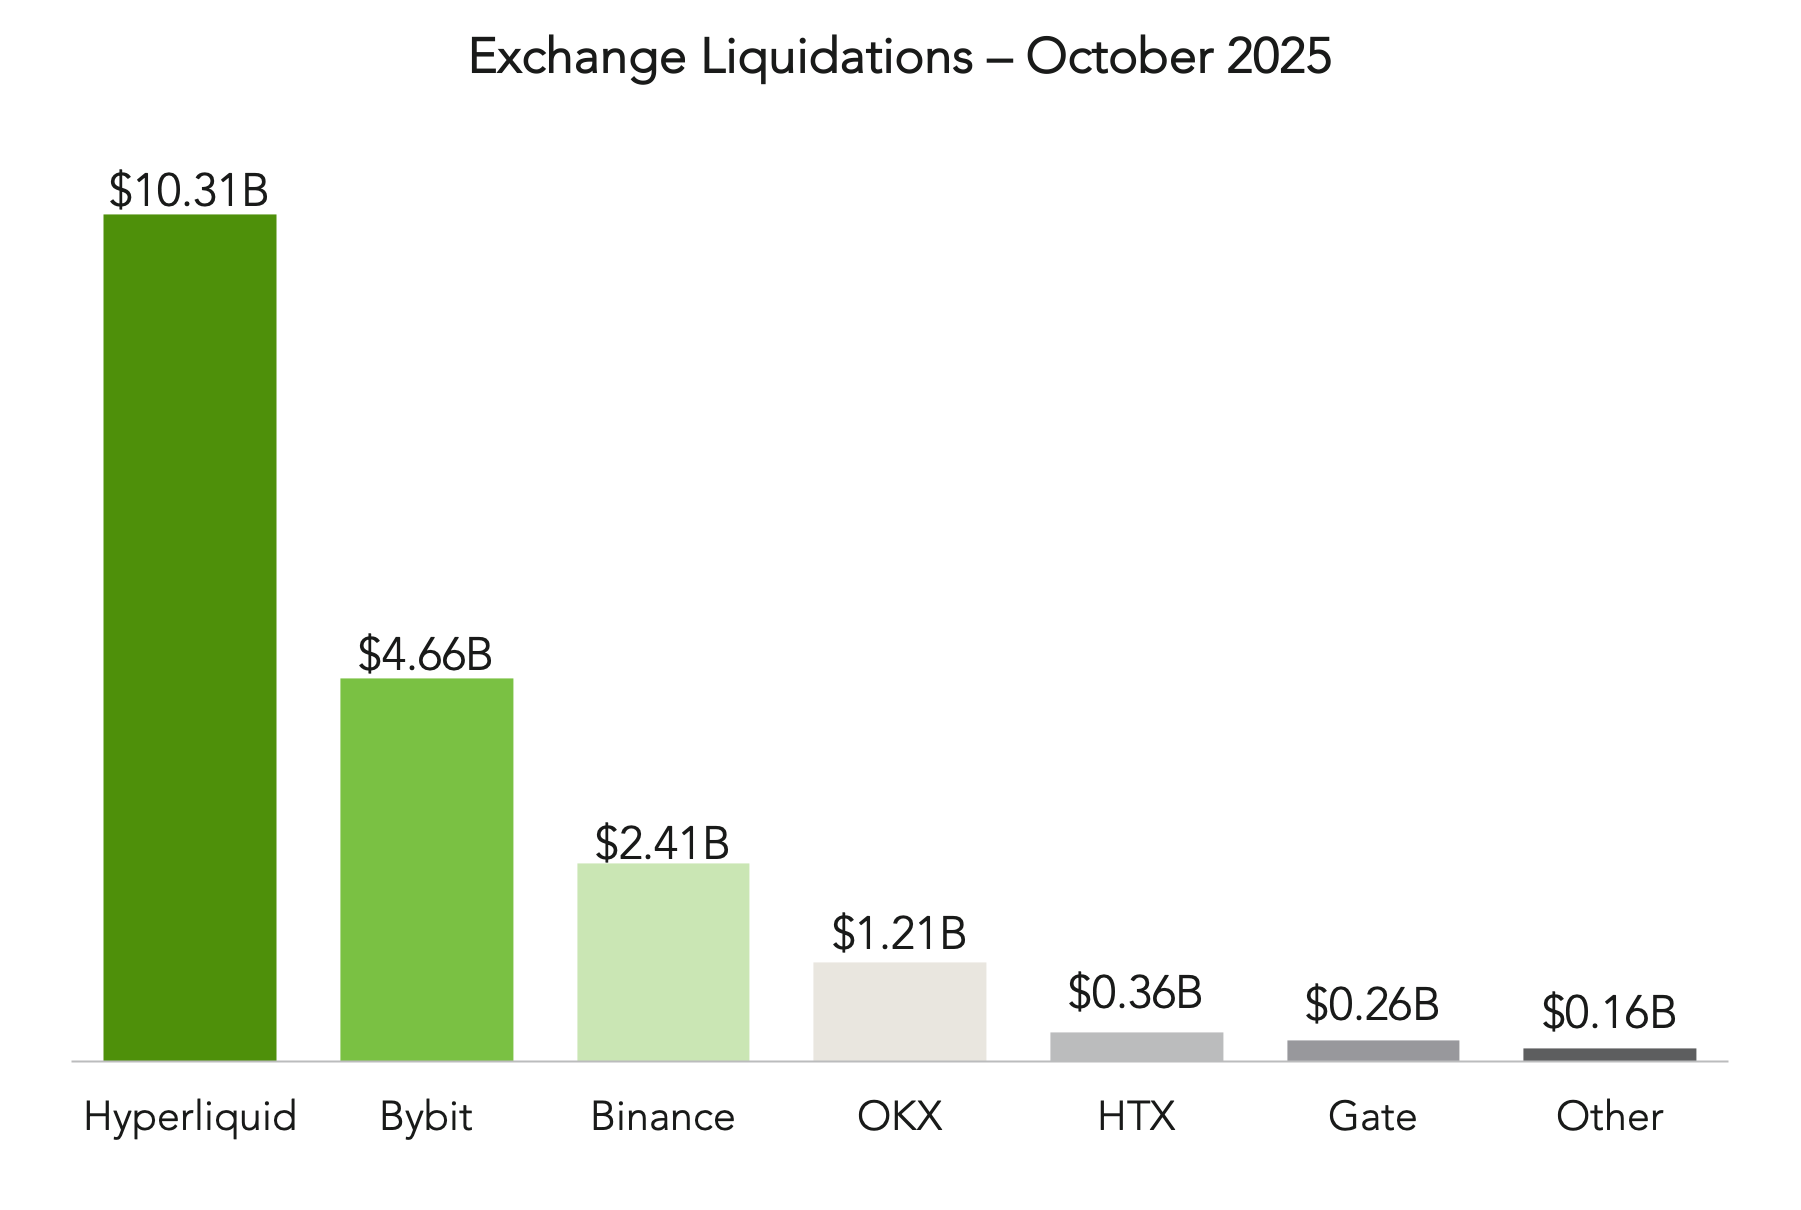
Figure 1
Source: TradingView, “Crypto Crash: $19.5 Billion Wiped Out In Record-Breaking Liquidation Event,” October 12, 2025. Other includes CoinEx ($69.43M), Bitfinex ($53.29M), and Bitmex ($38.53M).

Figure 2
Source: SoSoValue and Yahoo Finance.
For six consecutive years, October has been one of Bitcoin’s most reliable months, a phenomenon crypto natives dubbed “Uptober.” This seasonality became shorthand for cyclical optimism heading into Q4. But this year broke the streak, marking bitcoin’s first negative October since 2018 (Figure 3).
The reversal coincided with a series of macro headwinds that extended beyond crypto. U.S. fiscal tensions remain elevated amid a U.S. government shutdown (stretching past a historic 36 days at time of writing) that is halting most federal data releases and leaving investors navigating without reliable economic indicators. Further, the Federal Reserve cut rates by 25 basis points on October 29, lowering the target range to 3.75%-4.00%. While the move aimed to cushion slowing growth, Chair Powell’s accompanying statement, emphasizing “uncertainty about the economic outlook remains elevated,” tempered any dovish interpretation.
Against this backdrop, the usual Uptober dynamics lost their meaning. Seasonality may still appeal to retail traders, but as CIO Adil Abdulali notes, “In traditional finance, calendar effects like this carry little statistical significance. They tell you more about investor psychology than price mechanics.” The same applies increasingly to digital assets: short-term patterns can persist as narratives, but their predictive power fades as institutional participation deepens and market structure improves.
Macro data suggests additional explanation. Treasury yields declined while the U.S. Dollar Index (DXY) approached 100, signaling persistent risk aversion and tight dollar liquidity (Figure 4). Historically, falling yields would suggest easier financial conditions, yet the dollar’s firmness implied that capital continued to favor safety and U.S. assets. This pattern was reinforced on October 10, when renewed tariff announcements against China triggered a broad risk-off move, sending investors briefly into Treasuries, driving yields lower. At month-end, the Trump-Xi meeting in Busan delivered only a partial tariff rollback and a short-term reprieve for markets, underscoring how fragile trade dynamics and global liquidity conditions remain. In that context, crypto’s muted performance reflected macro-driven caution rather than weakening conviction.
In this environment, Bitcoin’s “Uptober” myth met macro reality. The streak’s end was less about fading confidence and more about a market responding to fundamentals, including policy uncertainty, fiscal strain, and liquidity tightening. For a maturing asset class, such narrative giving way to structure marks progress. This year, there was no “Hunt for Red Uptober” – just a market finding balance in a world where macro now matters more than memes.
When Seasonality Meets Macro Reality

Figure 3
Source: https://www.barchart.com/crypto/quotes/%5EBTCUSD/seasonality-chart

Figure 4
Source for US Dollar Index: Marketwatch. Source for 10-year Treasury yield: FRED Market Yield on U.S. Treasury Securities at 10-Year Constant Maturity, Quoted on an Investment Basis.
Despite a turbulent month that included policy shifts, tariff shocks, and the “Crypto Black Friday” unwind - the sharpest single-day liquidation in crypto history - both realized and implied volatility remained surprisingly contained.
On paper, that calm seems counterintuitive. The October 10 liquidation should have produced a sharp volatility spike, yet the Volmex BVIV, which tracks implied volatility in BTC options, registered a relatively modest uptick (Figure 5). Even as we entered the first week of November and BTC traded below $100,000, implied volatility remained subdued, far below levels of just one year ago. Similarly, realized 30-day volatility hovered at multi-year lows, even as bitcoin’s price swung from all-time highs near $125K to below $100K after month-end.
Macro context helps explain this anomaly. The October 10 event was triggered by renewed U.S.-China tariff headlines that sent investors fleeing into Treasuries, driving yields lower while risk assets sold off across the board. As leverage cascaded through derivatives venues, the impact on implied volatility was short-lived, contained by improved margin systems, deeper ETF liquidity, and institutional hedging activity. Unlike prior cycles, where similar shocks produced prolonged volatility expansions, this drawdown was absorbed within days.
Recent on-chain dynamics also reinforce the pattern. Long-term holders began trimming positions, a behavior that has appeared three times since late 2023 and historically preceded short-term cooling periods in bitcoin’s trend, as CoinDesk noted. While that might imply near-term consolidation, it also reflects disciplined profit-taking rather than structural stress, another marker of a maturing market.
The Golden Ratio Multiplier (Figure 6) places BTC near its 350-day moving average, underscoring a mid-cycle consolidation phase rather than exuberant or distressed conditions. The model draws on the Fibonacci sequence and the Golden Ratio (1.6) to create multiples of bitcoin’s 350-day moving average (specifically 1.6x and 2x in the chart) which have historically identified cyclical resistance and support levels. Bitcoin’s current proximity to the base trendline reflects a period of structural normalization: volatility remains low, and price action is anchored to fundamentals rather than speculative excess.
For sophisticated investors, the message should be clear. The absence of extreme volatility amid macro upheaval suggests that bitcoin is evolving from a sentiment-driven asset to a structurally integrated one. What signals fear or euphoria among retail investors now signals equilibrium – a market learning to absorb shock without losing shape.
Volatility Vanishing Act: Bitcoin’s Calm in the Chaos?
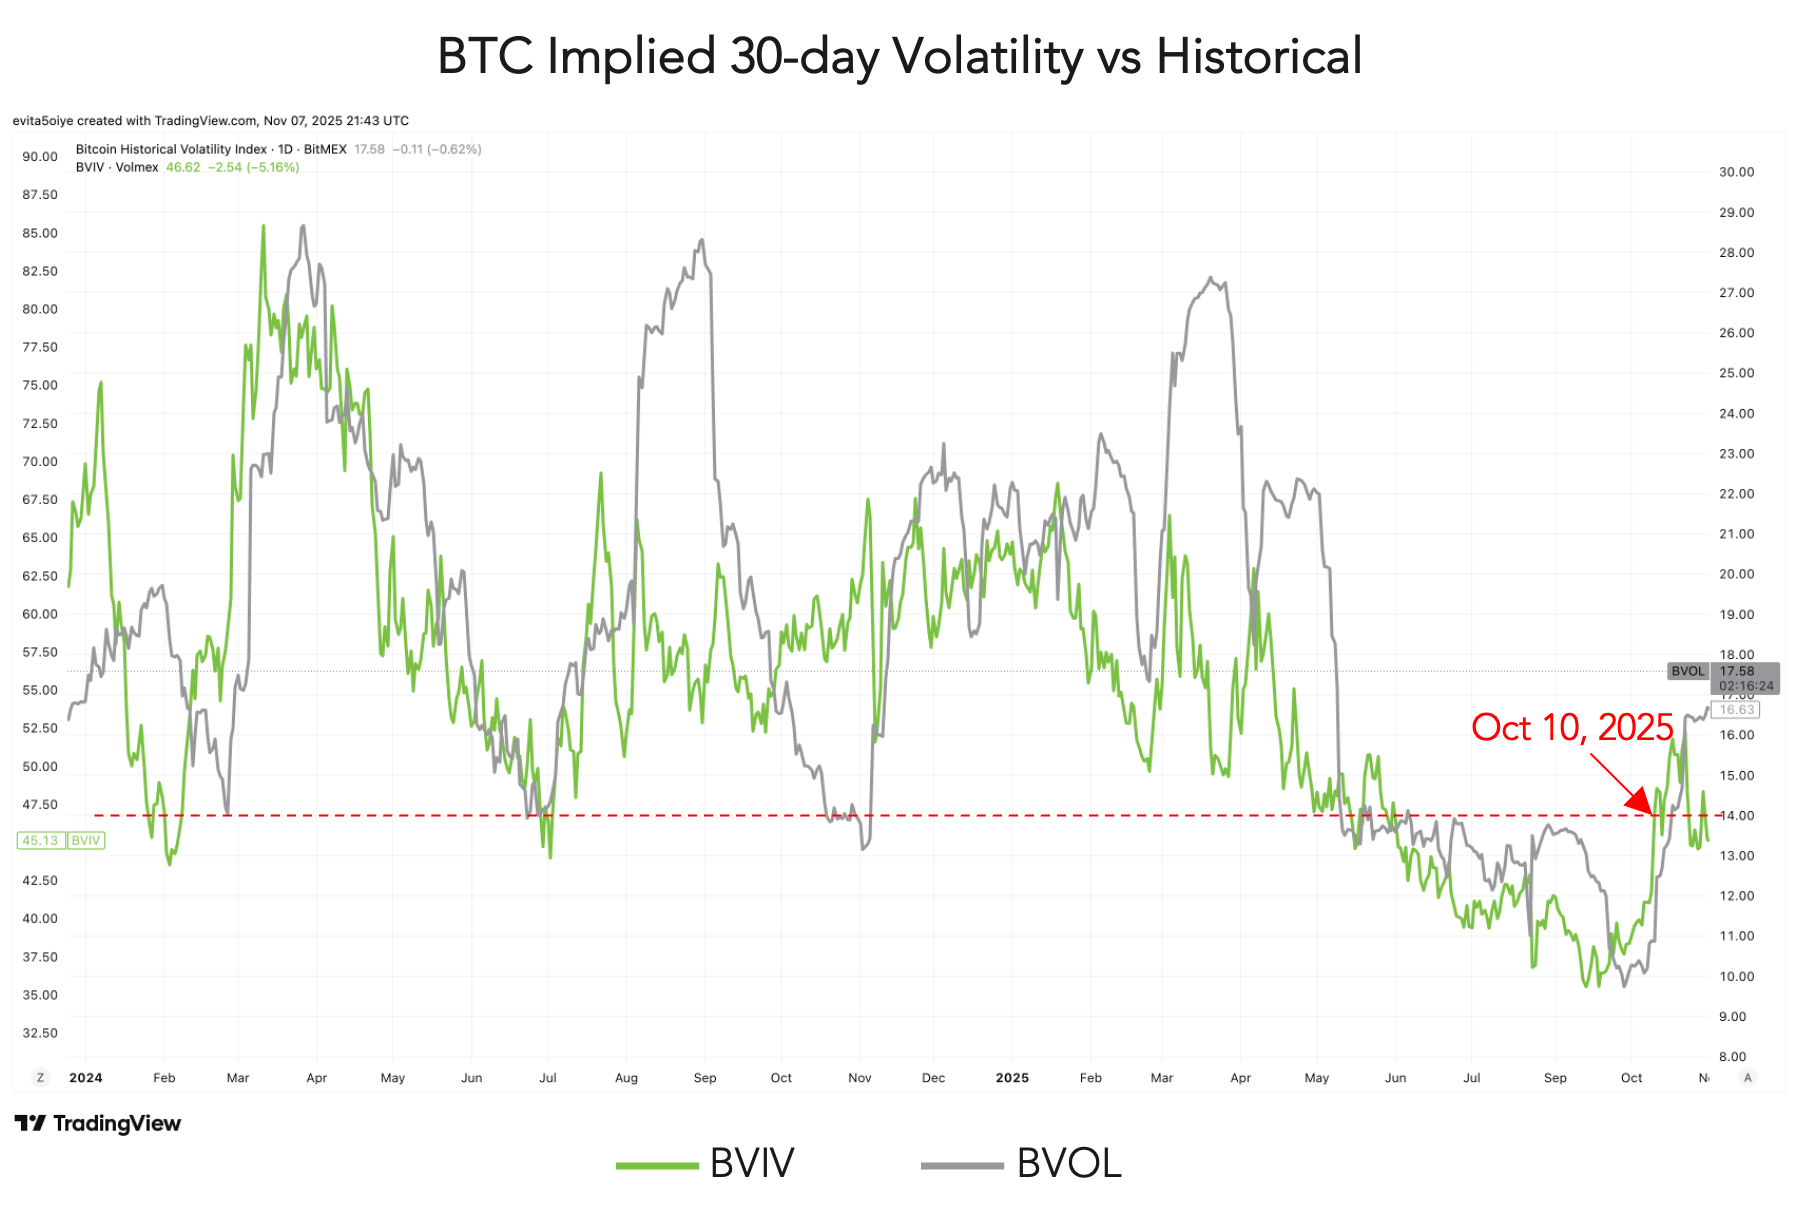
Figure 5
Source: TradingView Bitcoin Volmex Implied Volatility 30-Day Index (BVIV) and Bitcoin Historical Volatility Index (BVOL), January 2024 to October 31, 2025.

Figure 6
Source: Bitcoin Magazine Pro https://www.bitcoinmagazinepro.com/charts/golden-ratio-multiplier/ July 1, 2023 to October 31, 2025. As Bitcoin becomes adopted over time, it's market cycle highs hit decreasing Fibonacci sequence multiples of the 350-day moving average. This is because the explosive growth of Bitcoin is slowing over time. As it's market cap increases, it becomes more difficult for the same growth rates to continue.