
Graphing Digital Assets
Month in Review — September 2025
Stablecoins Stepping onto the Main Stage
Stablecoins are increasingly moving beyond their origins in crypto trading to become infrastructure for global payments and corporate finance. Citi’s Stablecoins 2030 report projects issuance volumes of $1.9 trillion in its base case and $4.0 trillion in its bull case by 2030, supporting as much as $100–$200 trillion in annual settlement activity (Figure 1). The acceleration reflects the growing number of practical, large-scale applications.
Enterprises are beginning to integrate stablecoins into day-to-day operations. PayPal has launched PYUSD for commercial payments, while Stripe and Mastercard are embedding stablecoin settlement into merchant ecosystems. Payments infrastructure firm BVNK processes over $12 billion annually for clients such as Ferrari and Rapyd. Payroll platforms like Rain use stablecoins to deliver instant cross-border wages, cutting remittance costs, and new blockchains like Plasma are being designed to handle enterprise-grade stablecoin settlement. The result is a steadily widening set of use cases, from treasury operations and contractor payments to tokenized asset settlement.
The infrastructure supporting this shift is consolidating around a few major blockchains. Base, Tron, Ethereum, BNB Chain, and Solana have emerged as the primary settlement rails, contributing to a record $6+ trillion in transactions in September (Figure 2). These blockchains function like highways for digital dollars, carrying stablecoin flows at scale with predictable costs and minimal friction. Their dominance signals that stablecoin activity is maturing into a handful of proven, high-capacity corridors rather than remaining fragmented across experimental platforms.
With the GENIUS Act providing regulatory clarity in the U.S., adoption is set to accelerate further. Stablecoins are becoming embedded rails for global commerce, payments, and treasury functions. As corporates expand adoption, stablecoins are positioned not only to transform cross-border finance but also to cement their role as a structural component of the financial system.

Figure 1
As of September 30, 2025. Sources: DefiLlama and Citi “Stablecoins 2030 - Web3 to Wall Street,” September 2025. (1) Partial reallocation of USD bank notes held domestically and offshore, deposits and similar. (2) Partial substitution of international short-term liquidity (excluding U.S. and China) into USD and other local currency stablecoins.
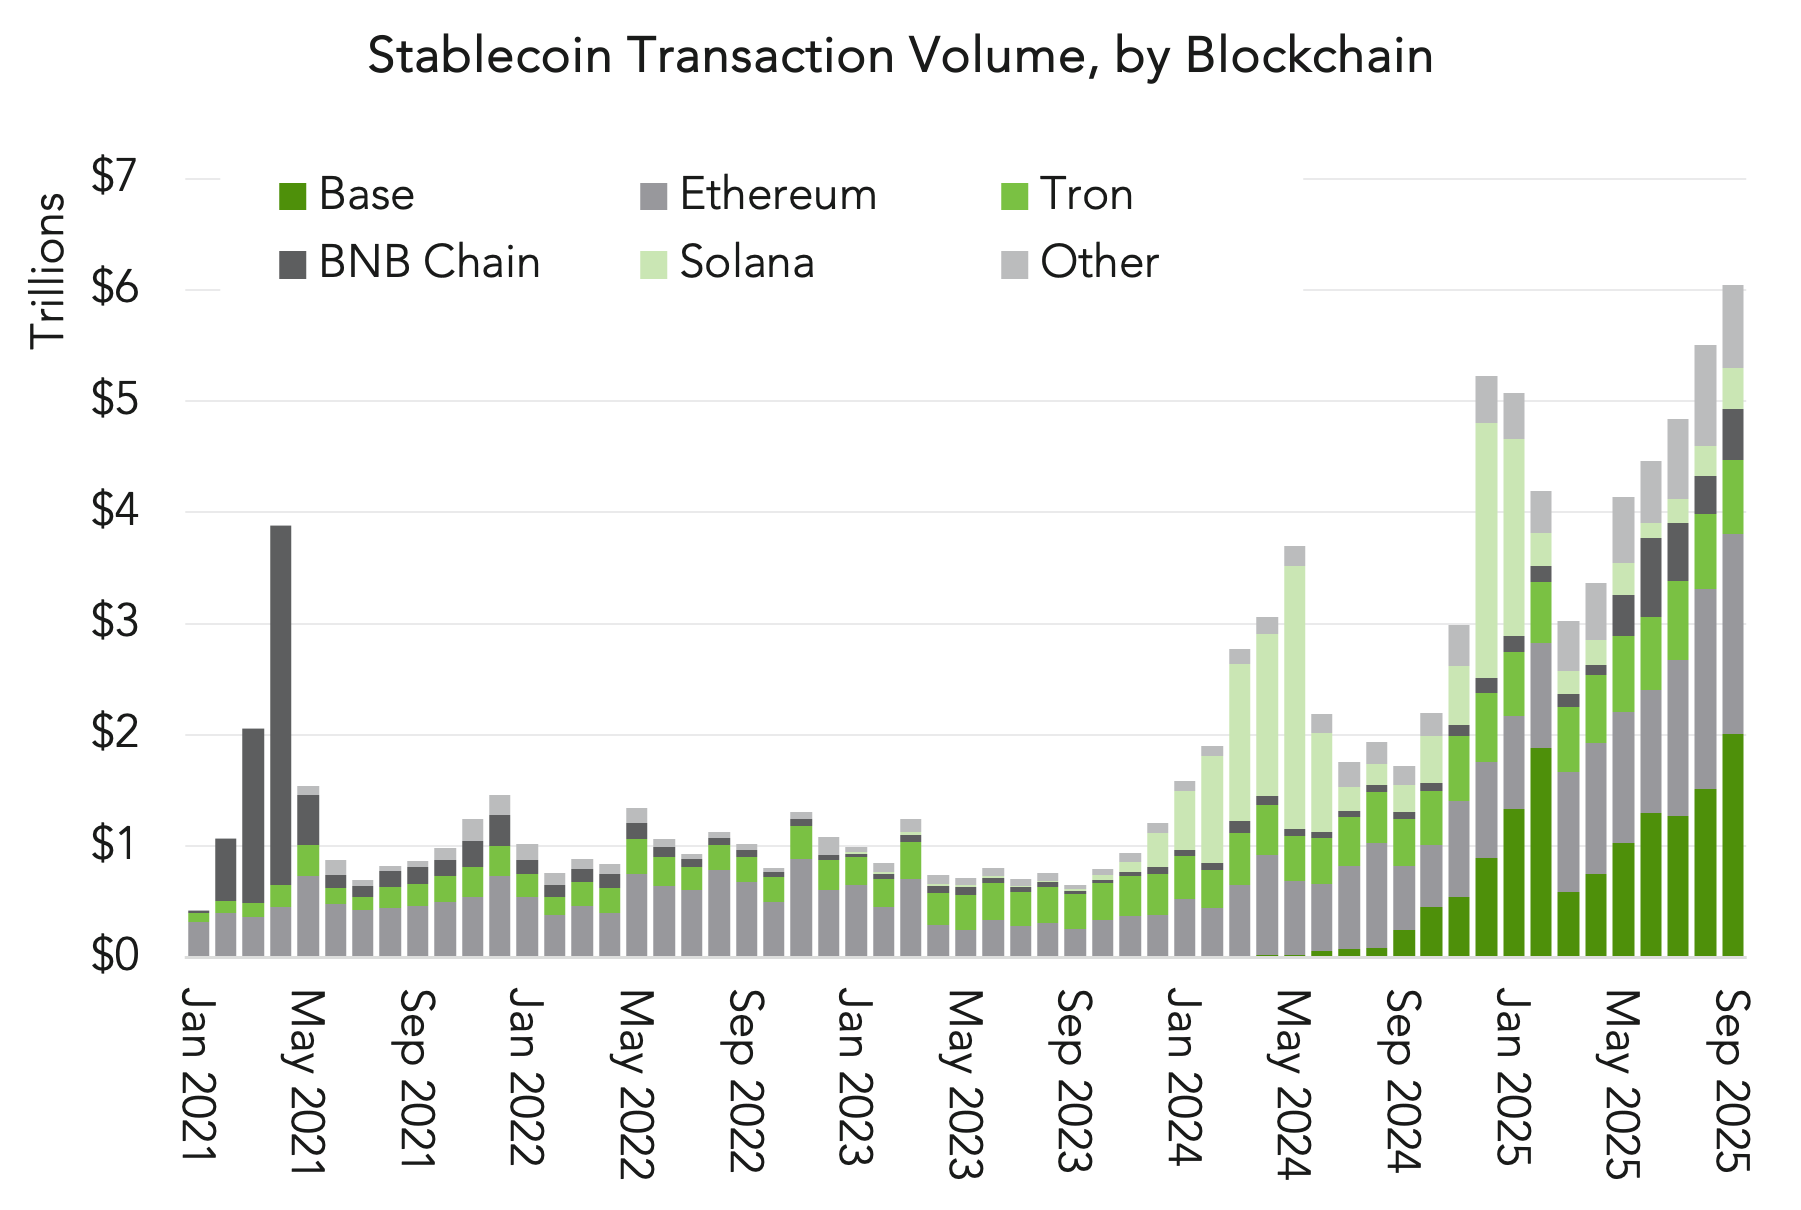
Figure 2
Source: Artemis Analytics; data retrieved October 6, 2025. “Other” includes (from largest to smallest) Sui, Avalanche C-Chain, Arbitrum, Aptos, Polygon, PoS, Linea, Plasma, Celo, HyperEVM, Kaia, Katana, Mantle, OP Mainnet, Ripple, Sei Network, Sonic, Stellar, and TON.
In crypto, the line between centralized finance (CeFi) and decentralized finance (DeFi) is narrowing, and competition among decentralized exchanges has intensified. CeFi exchanges (CEXs) such as Binance and Coinbase custody client assets and process trades on internal servers, while DeFi exchanges (DEXs) rely on smart contracts that enable self-custody and on-chain settlement. CeFi venues still dominate in liquidity and regulatory reach, but DeFi platforms are catching up fast – building scale, refining execution, and attracting flows that once belonged exclusively to centralized digital asset players. That distinction between CEXs and DEXs is giving way to open conflict as a new generation of DeFi exchanges challenge old leaders.
September delivered the first trillion-dollar month in decentralized perpetual futures, a milestone that reshaped the leaderboard, with Hyperliquid, Aster, and Lighter defining the front line of on-chain derivatives trading (Figure 3). Hyperliquid has led since it first surpassed dYdX in 2024, earning a reputation as one of the most reliable and trustworthy venues in the space. Lighter climbed steadily to the second spot by April 2025, maintaining consistent participation even through a brief delisting and reinstatement on DeFiLlama. But in September, both were eclipsed by CZ-backed Aster, which continues to challenge Hyperliquid’s top position despite its own delisting from DeFiLlama over data-integrity concerns after its reported volumes appeared to mirror Binance’s almost exactly. The market’s reaction has been telling: despite transparency questions, capital and activity continue to pour into Aster, suggesting that liquidity may matter more than verification. The field remains competitive, but the more profound shift lies in how these platforms now overlap with centralized exchanges.
This battle is significant not only because of who captures share among DeFi protocols, but also because it is unfolding on ground once dominated by centralized exchanges. DeFi’s share of global futures trading has expanded from nearly 3% in early 2024 to more than 13% in September, and surged to 18% in the first week of October 2025 (Figure 4). Coinbase’s recent integration of DEX trading into its main app blurs the line further. For millions of users, the distinction between centralized and decentralized execution is disappearing as CEX interfaces now deliver direct access to DeFi liquidity. In effect, while Hyperliquid and Aster compete on-chain, CEXs ensure the outcome reaches its customer base.
The exponential rise in on-chain trading underscores how quickly decentralized markets are gaining ground on CeFi, fueled by deeper liquidity, more sophisticated participants, and a growing acceptance of hybrid execution models.
For allocators, the “war” of the DEXs is more than a contest for market share; it signals that liquidity, execution, and user access are converging into a hybrid model where CeFi and DeFi no longer operate as separate camps but as parts of a single market.
The War of the DEXs

Figure 3
Source: Artemis Analytics as of October 6, 2025

Figure 4
Source: The Block; DefiLlama, as of October 6, 2025. Monthly decentralized exchange futures volumes divided by centralized exchange futures volumes (as a percentage). Includes largest exchanges with trustworthy reporting of exchange volume metrics.
“Resilience” in Modern Markets
September marked the 24th anniversary of the 9/11 attacks in the U.S., a moment that continues to evoke reflection, particularly for those of us who lived and worked through its aftermath. Each year reminds us not only of the loss and resilience that followed, but also of how profoundly the world, including financial markets, has evolved since.
When U.S. markets reopened on September 17, 2001, after a four-session shutdown, the Dow had fallen 7.13%, the S&P 500 was down 4.92%, NASDAQ dropped 6.83%, and Treasuries saw a 4.63% loss (Figure 5). Beneath the surface, financial infrastructure was under strain, with Treasury settlement failures elevated until early October as desks struggled to clear and deliver securities. These operational challenges, though not visible in price data, contributed to the slow pace of recovery and exposed the vulnerabilities of concentrated, centralized market infrastructure under stress.
More than two decades later, investors operate in a markedly different landscape, as evidenced by the rebound following the March 2023 bank crisis (Figure 6). Though shocks reverberated through financial institutions and liquidity channels, markets remained open, pricing adjusted rapidly, and stability returned within days, demonstrating a higher degree of system flexibility than in prior crises.
Today, trading never fully stops. Spot crypto trades 24/7/365 across venues, and policymakers are exploring tokenized Treasuries that could trade continuously, potentially reducing the risk of closed-market gaps and providing continuity when it matters most. While such advances do not eliminate risk, they broaden where and when liquidity is available.
A key takeaway is not that any single asset offers protection, but that resilience now stems from diversified market structures and multiple avenues for liquidity. Crypto’s continuous trading and the emergence of tokenized, always-settleable instruments extend market access beyond traditional hours. The infrastructure surrounding digital assets adds a new dimension to system-level resilience, an important consideration for allocators building portfolios that can adapt across time zones, avoid bottlenecks, and tap into diverse liquidity sources when shocks occur.
Figure 5
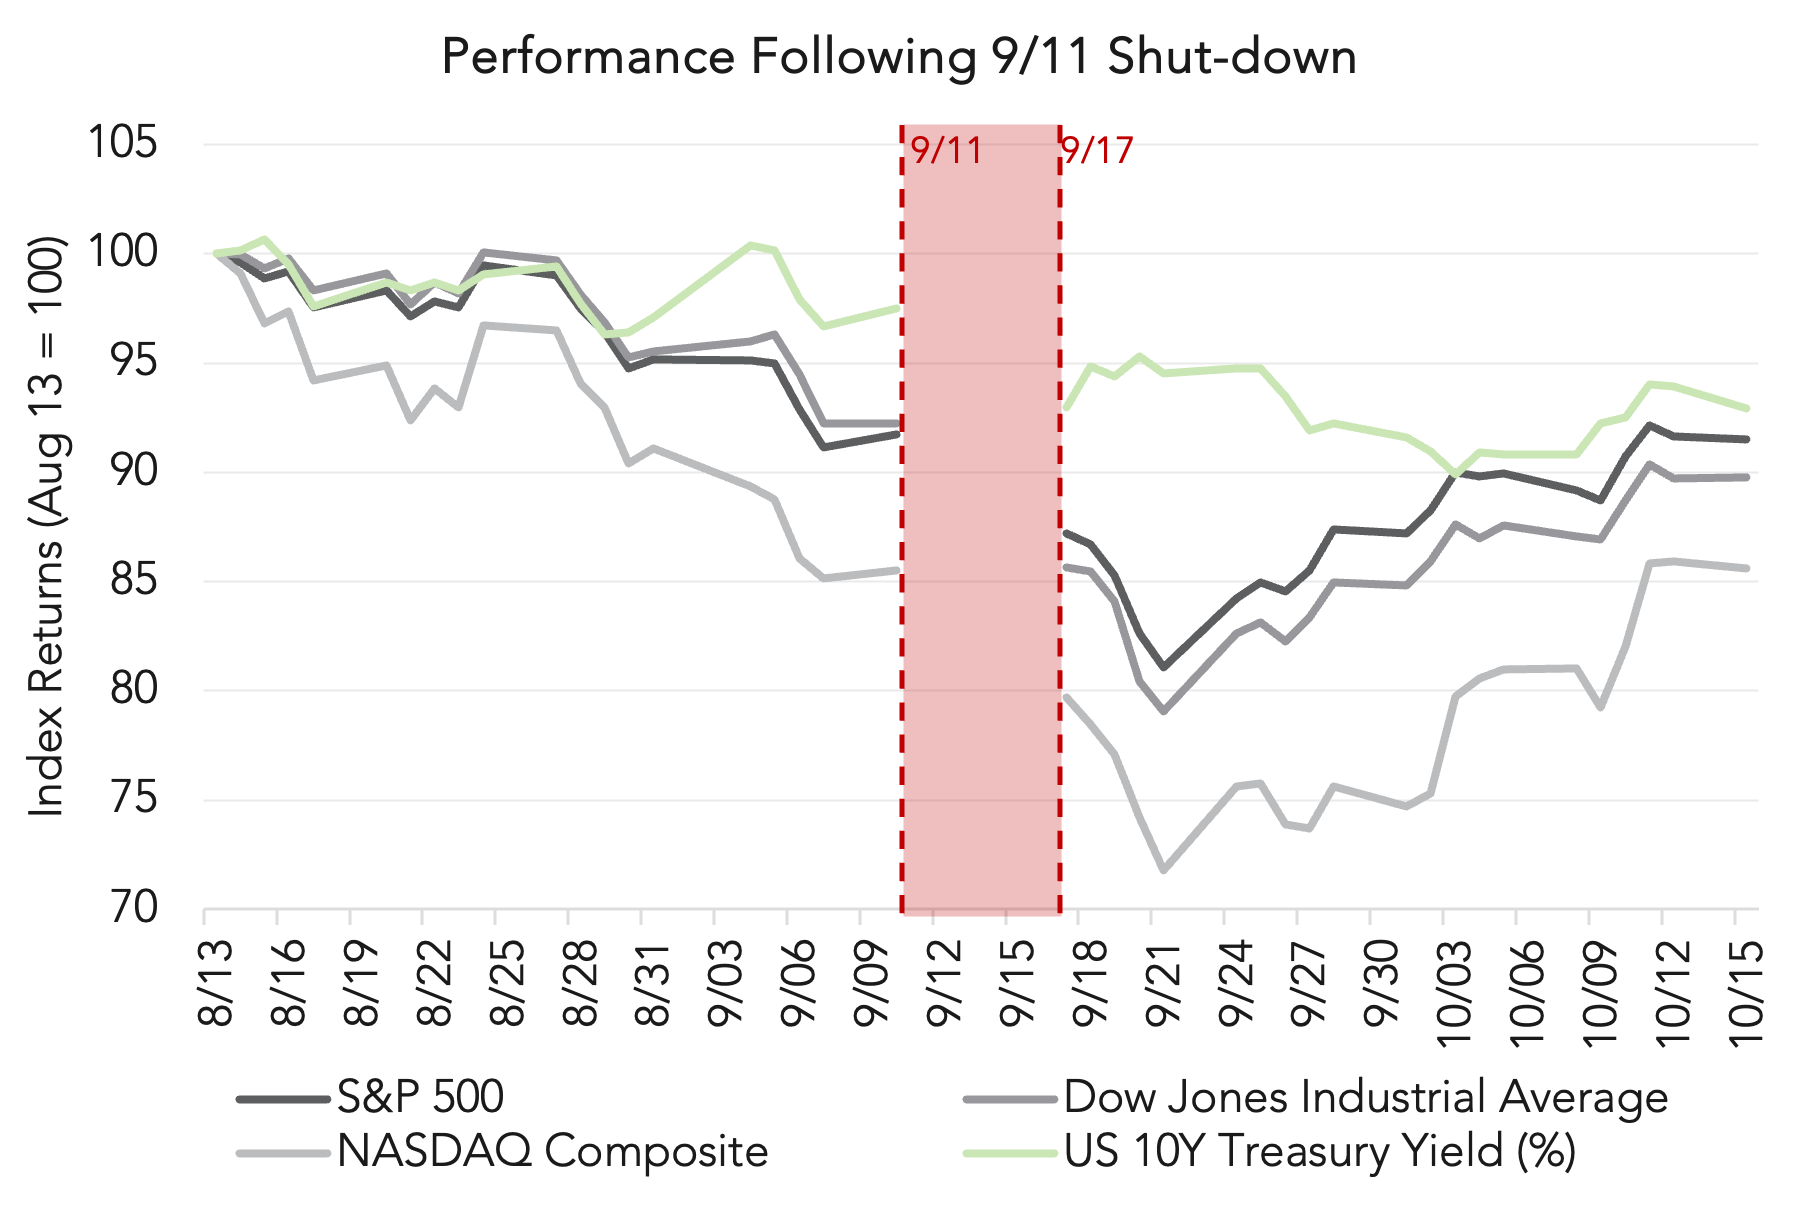
Source: Yahoo Finance. Data retrieved September 11, 2025.

Figure 6
Source: Yahoo Finance. Data retrieved September 11, 2025.