
Graphing Digital Assets
Year in Review — 2025
As we enter 2026, the digital asset market does so against a markedly different backdrop than a year ago, emerging with greater institutional relevance, structural depth, and scale than in prior cycles. The developments of 2025 revealed a market no longer driven by singular narratives, but one shaped by evolving infrastructure, shifting participation, and more disciplined capital behavior. Multiple Federal Reserve rate cuts reshaped global liquidity conditions, spot bitcoin ETFs continued to alter market access and capital flows, and landmark legal proceedings tested how on-chain activity is interpreted within existing financial frameworks.
Against this backdrop, growth across settlement rails, tokenized real-world assets, and decentralized finance — alongside shifting sentiment and increased balance-sheet scrutiny — offered clear signals of a more mature market. The charts that follow revisit key developments from 2025 as a framework for understanding the forces likely to influence digital asset markets in the year ahead.
Total Tokenized Real World Assets - 2025
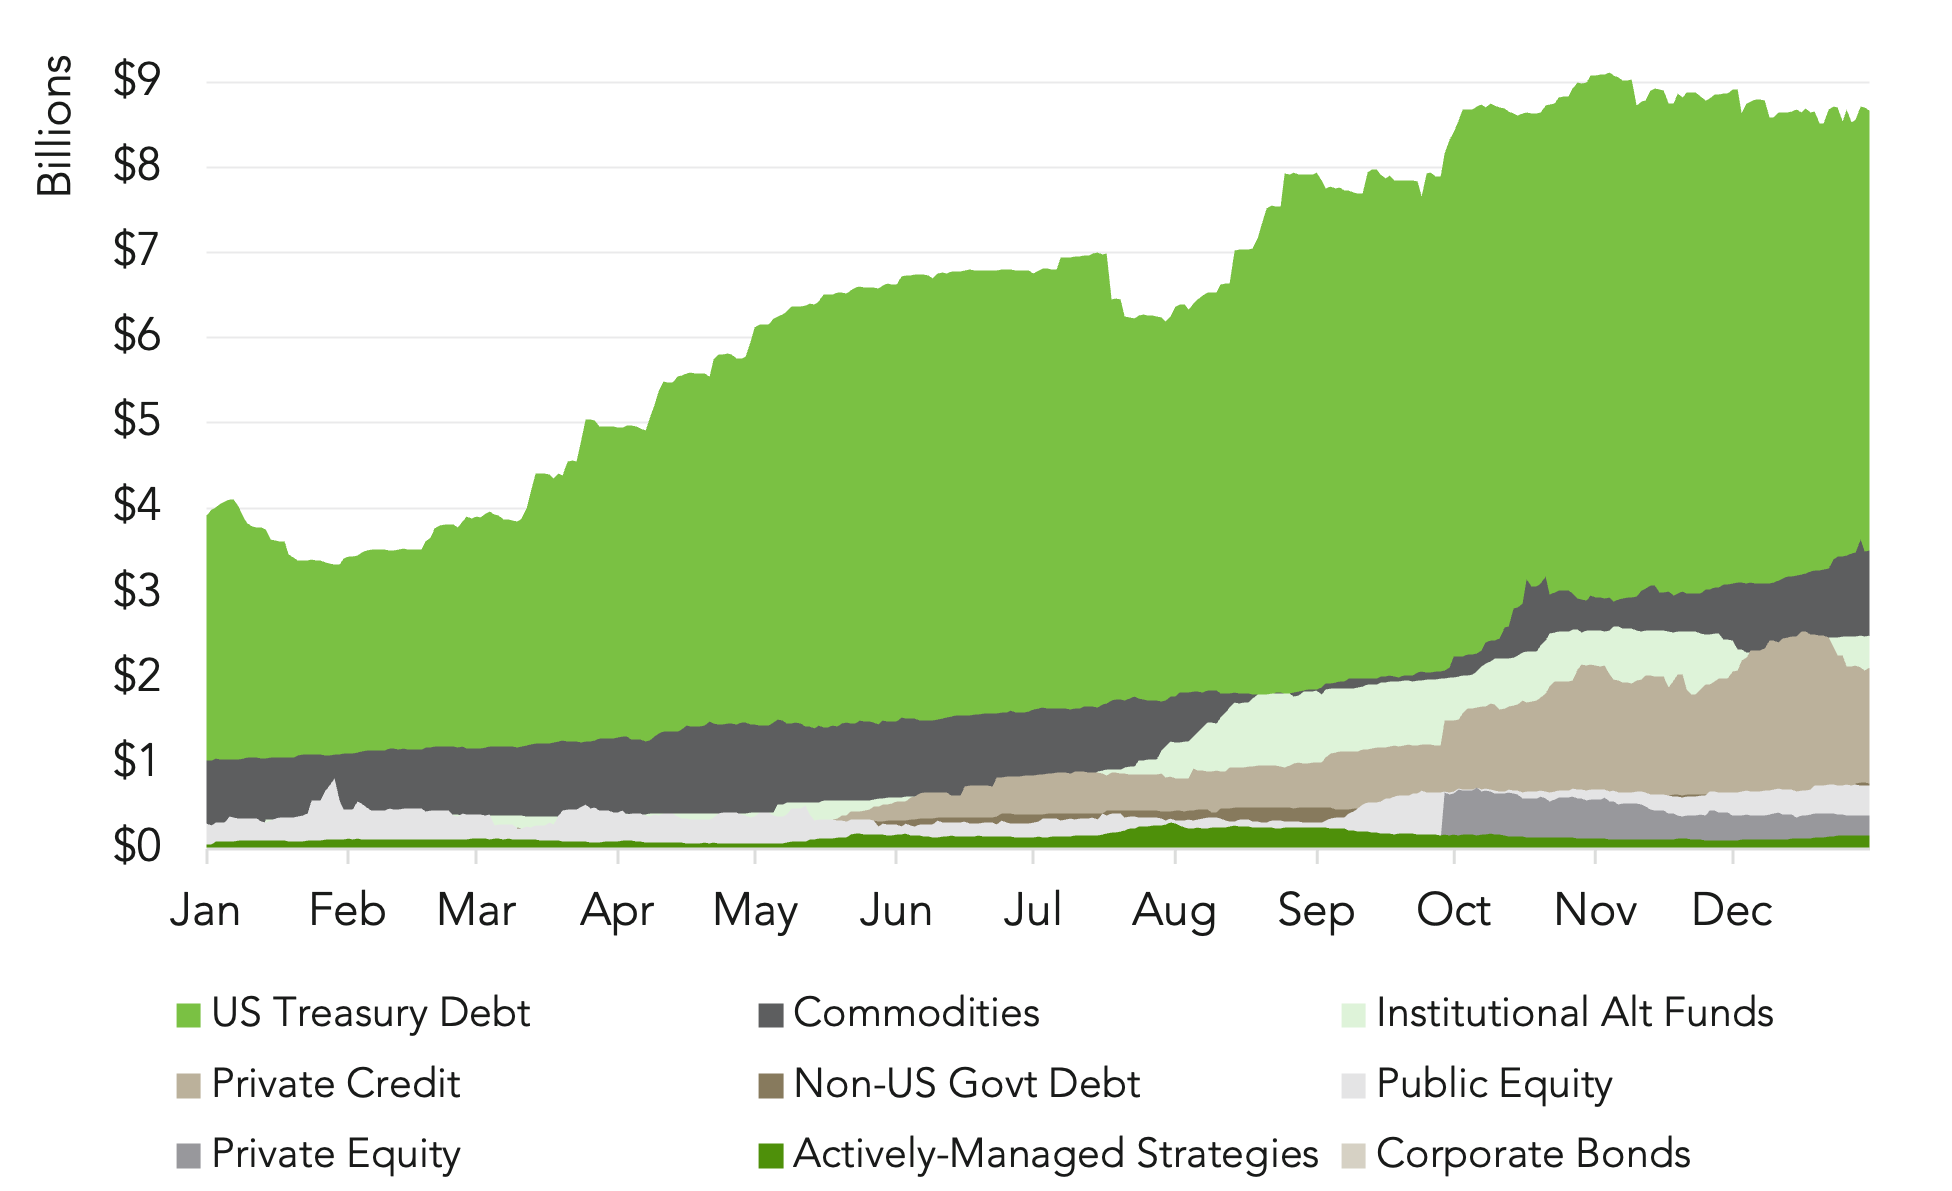
Enhanced regulatory clarity in the U.S. helped accelerate the growth of real-world asset (RWA) tokenization in 2025, particularly among institutions that recognize the operational and settlement efficiencies of transacting on-chain. Asset classes with historically high barriers to entry increasingly turned to tokenization as a mechanism to broaden access and improve liquidity. Total tokenized assets nearly tripled in 2025, growing from approximately $5.6 billion to nearly $18.9 billion, led by U.S. Treasury debt and commodities, followed by institutional alternatives and private credit.
Source: rwa.xyz as of December 31, 2025 (data retrieved January 2, 2026).
Crypto vs. Equities - Fear and Greed in 2025
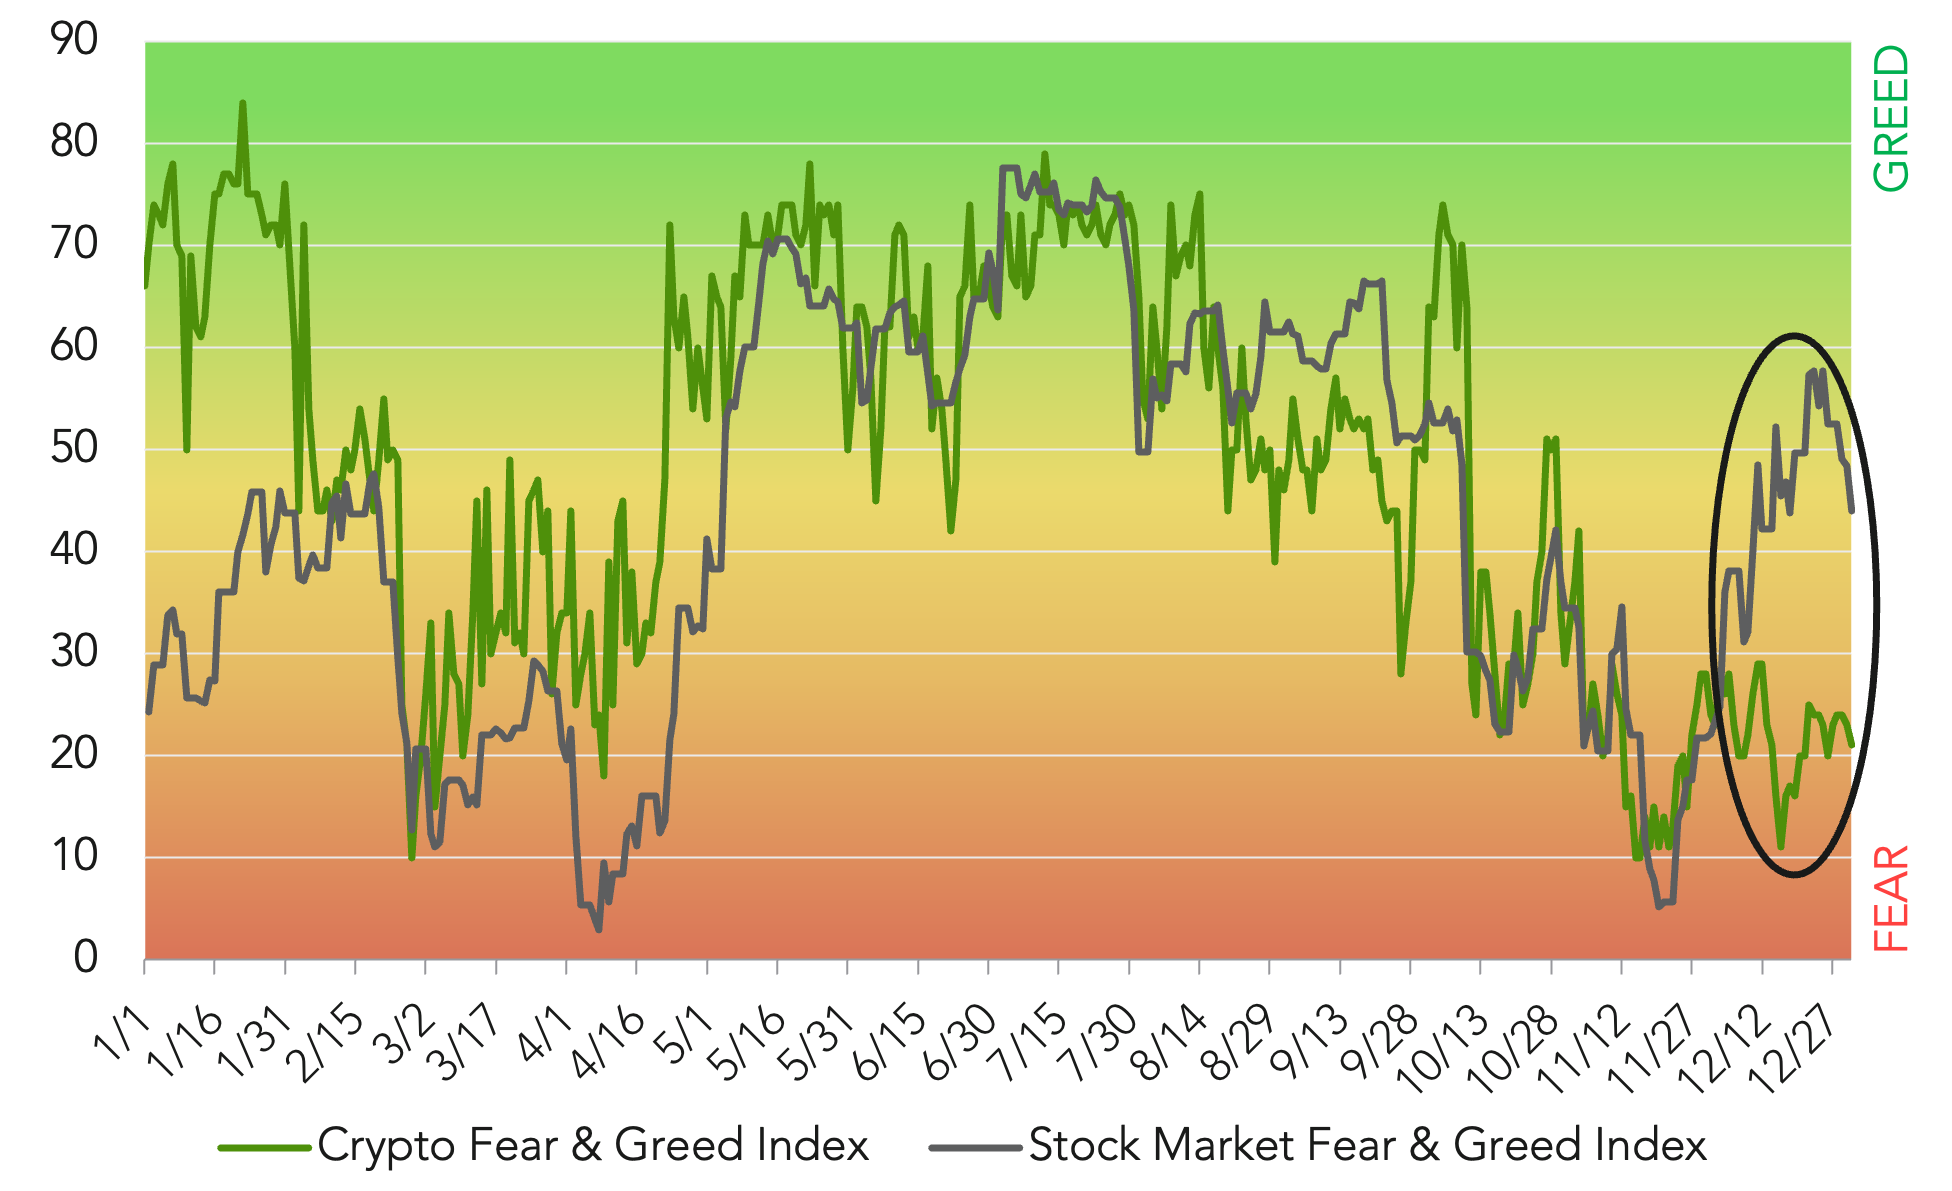
Bitcoin broke $100,000 for the first time as 2025 opened, fueling bullish sentiment and renewed confidence across digital assets. As crypto continued its transition toward broader institutional participation, parallels emerged between digital asset and equity investing. In the fourth quarter, sentiment among the asset classes diverged again, as equities moved out of fear while crypto remained risk-averse, suggesting an evolving digital asset market, increasingly shaped by institutional positioning, risk management, and macro sensitivity rather than speculative momentum.
Sources: https://alternative.me/crypto/fear-and-greed-index/ & https://www.cnn.com/markets/fear-and-greed.
Total Stablecoin Supply
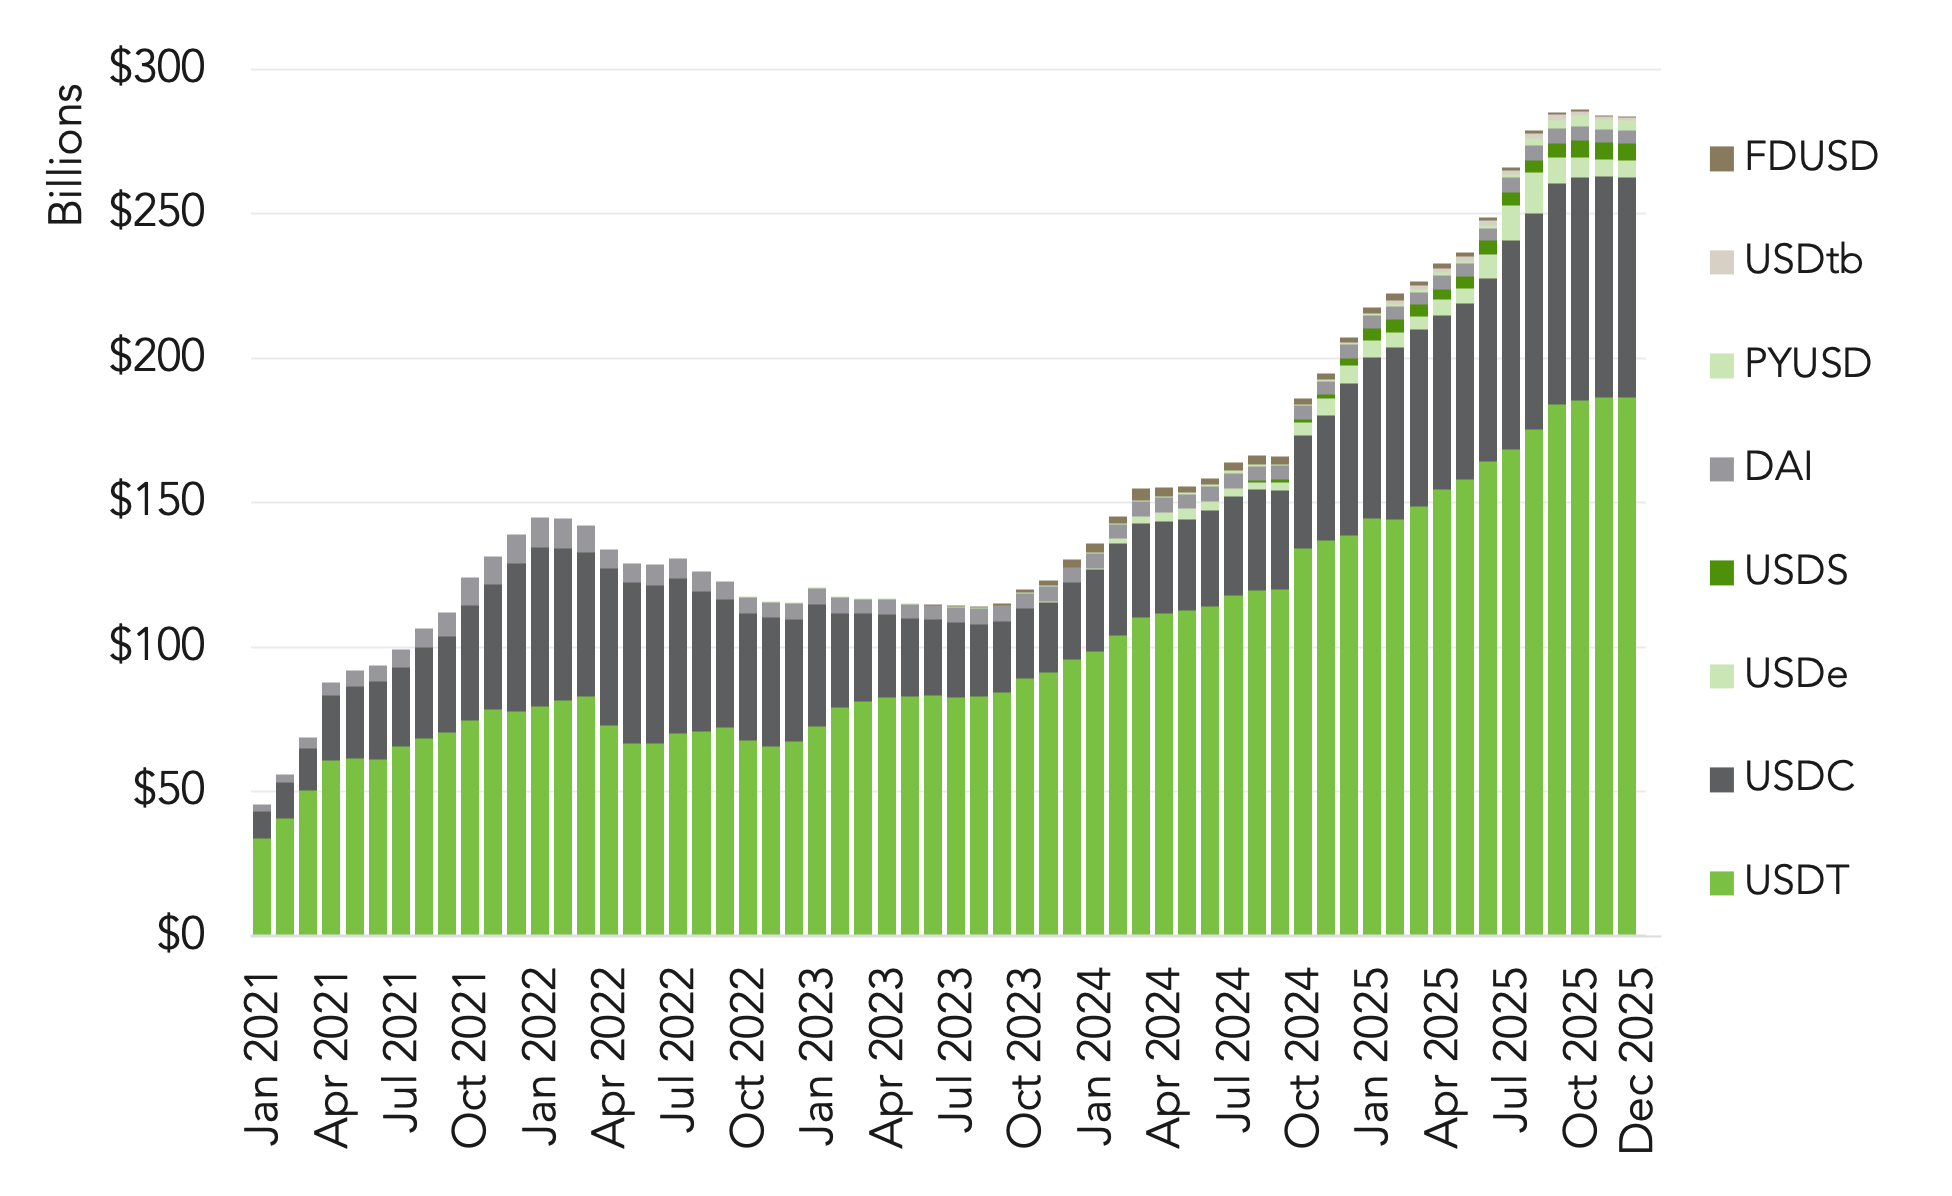
The landmark bipartisan passage of the GENIUS Act in July 2025 helped accelerate stablecoin growth in 2025, with market capitalization reaching approximately $308 billion by year-end, a roughly 50% increase year-over-year. The year also saw nearly 40% growth in stablecoin supply, alongside a sharp rise in usage, with adjusted transaction volumes exceeding $4 trillion in December alone. As stablecoin adoption continued to scale, McKinsey estimated that annual stablecoin transaction volumes had surpassed $27 trillion and could approach traditional payment systems over the coming decade.
Sources: Artemis Analytics and DefiLlama as of December 31, 2025.
Strategy (MSTR) NAV Premium (Basic Shares) – 2025
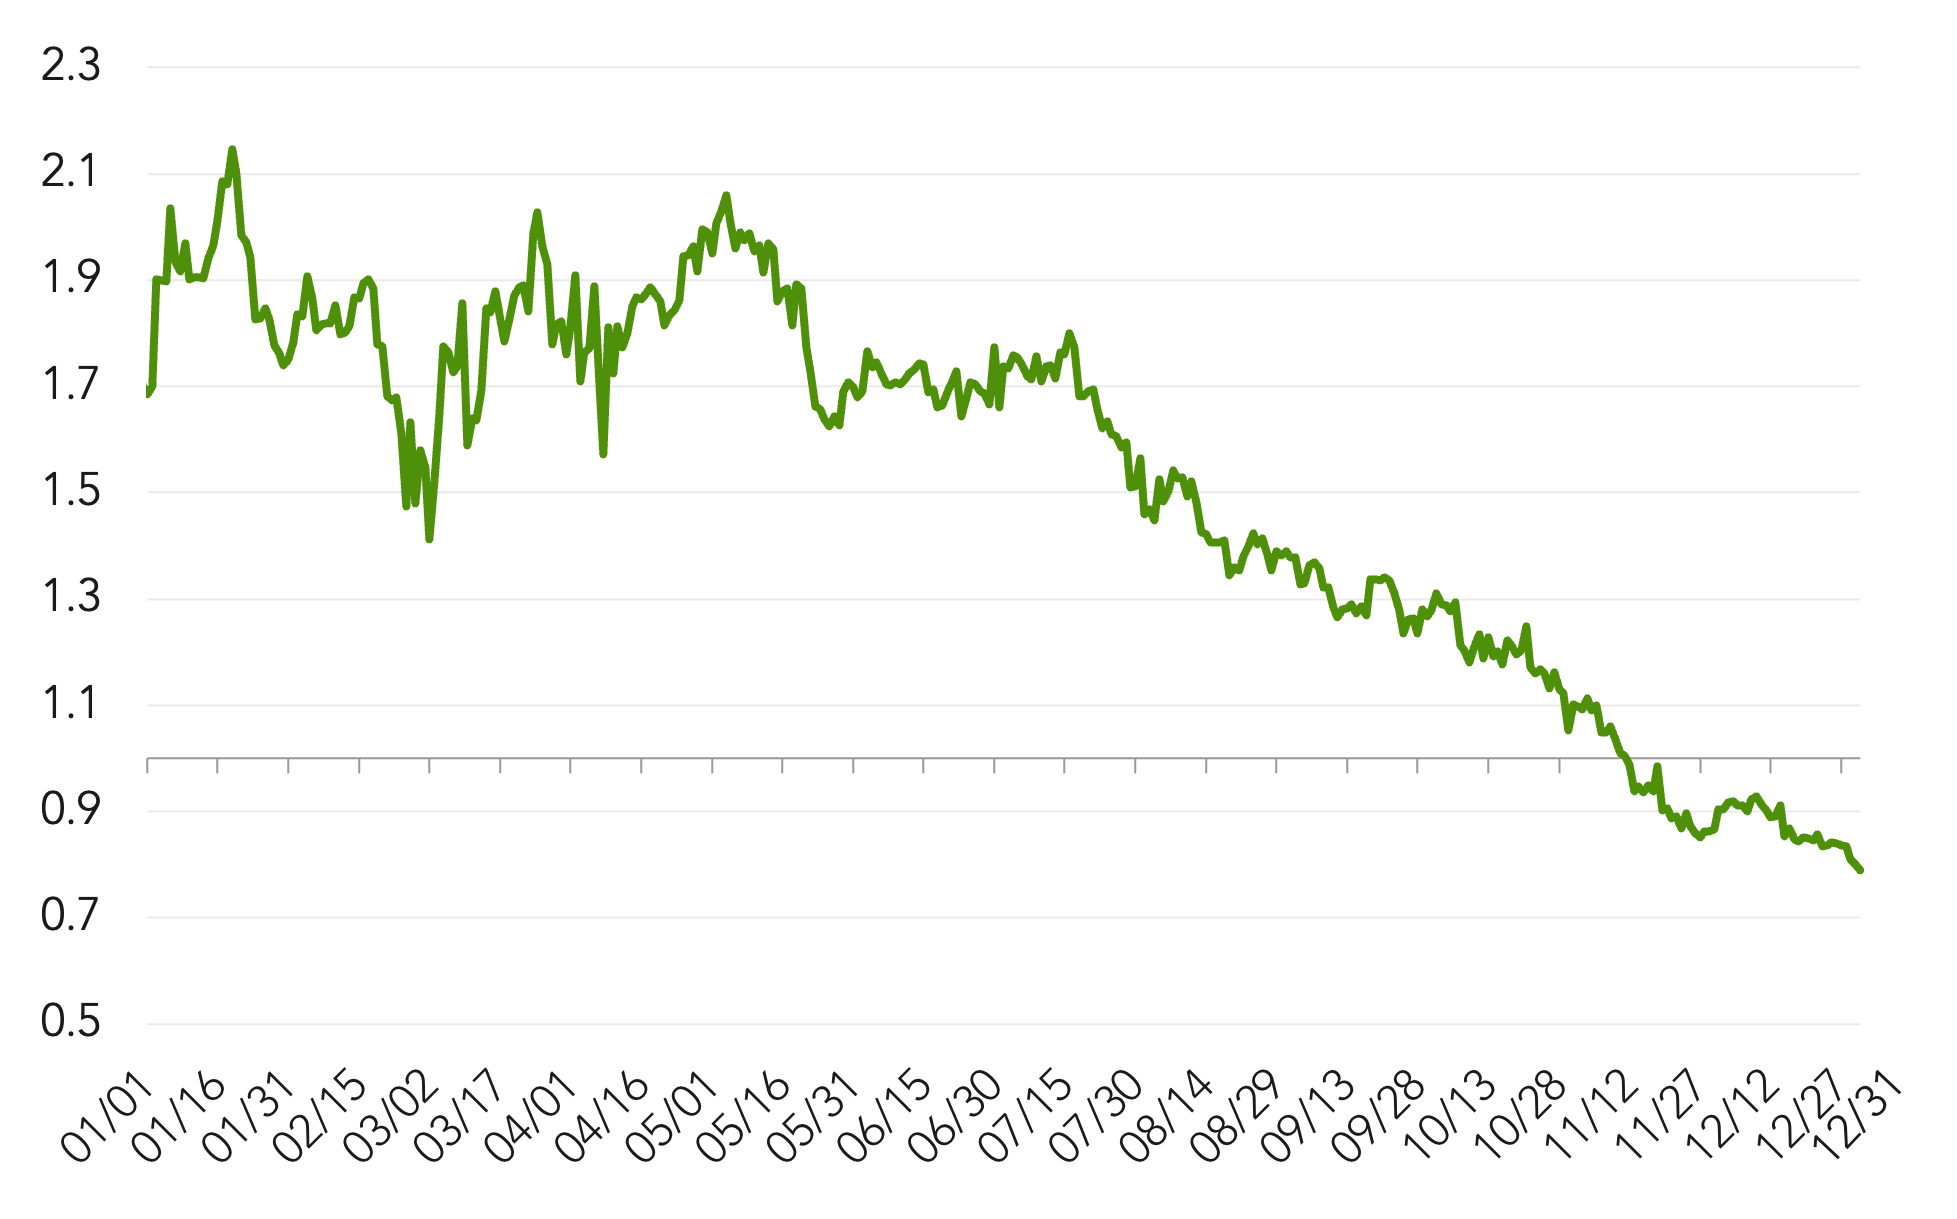
Companies that relied on bitcoin treasury strategies to drive equity value saw those premiums compress over the course of 2025. As bitcoin’s price action shifted, early enthusiasm for BTC-heavy balance sheets gave way to more disciplined equity pricing, with firms such as Strategy (MSTR) ultimately trading at a discount to their underlying bitcoin holdings. This shift reflects growing investor scrutiny around leverage, dilution, and capital structure, underscoring that simply holding bitcoin is insufficient to create shareholder value.
Source: strategytracker.com
Bitcoin, Gold, and the U.S. Dollar: Diverging Paths in 2025
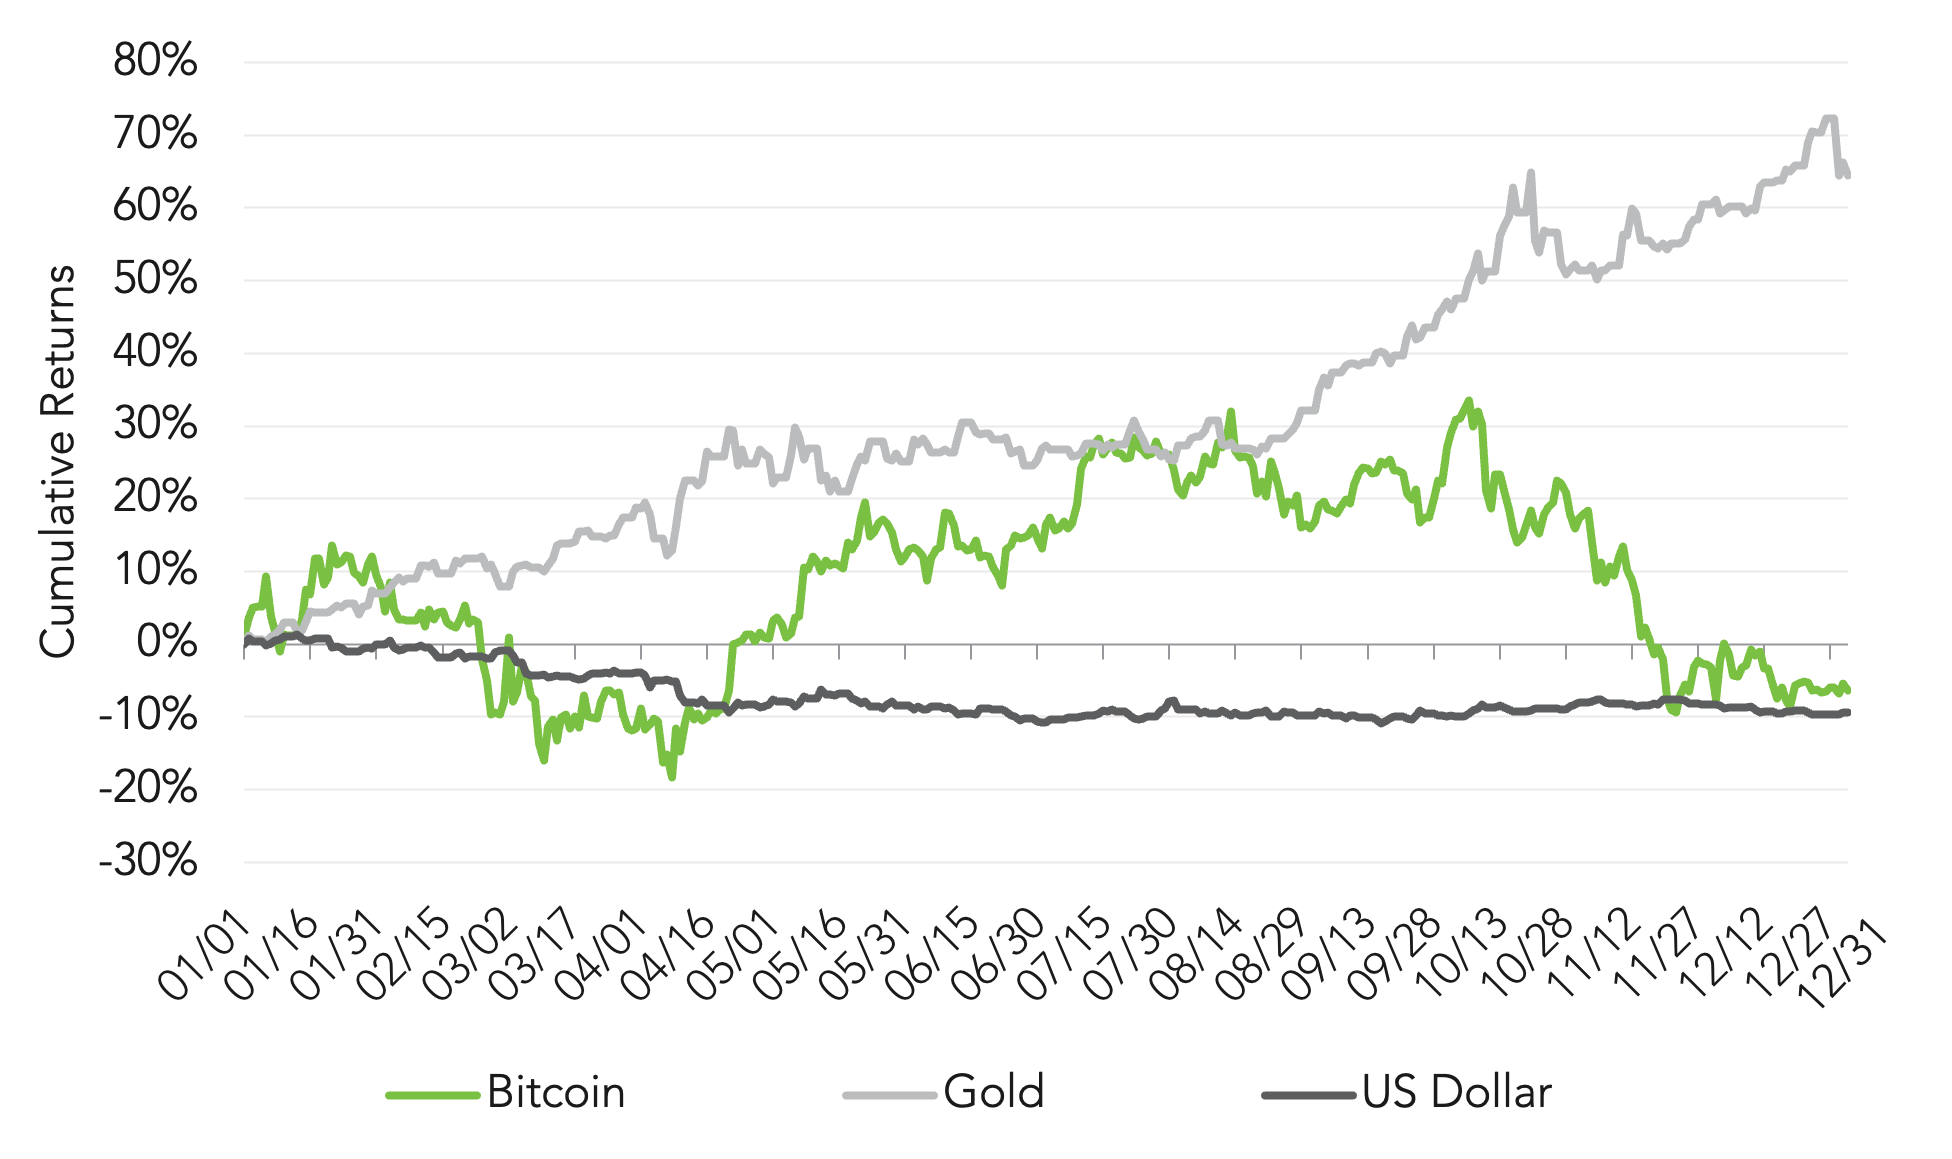
In 2025, bitcoin proved to defy simple classification, trading neither fully as digital gold nor as an inverse to the U.S. dollar. While gold delivered strong, steady gains amid macro uncertainty, bitcoin’s performance was more episodic, alternating between risk-on rallies and late-year drawdowns. Notably, bitcoin weakened alongside a softer dollar in the fourth quarter, challenging the notion of a consistent inverse relationship. This behavior underscores bitcoin’s evolving role within portfolios: less a singular hedge and increasingly a regime-dependent asset shaped by liquidity conditions, positioning, and macro sensitivity.
Source: BTC-USD, GC=F, and DXY from Yahoo Finance as of December 31, 2025.
DeFi Total Value Locked (TVL)
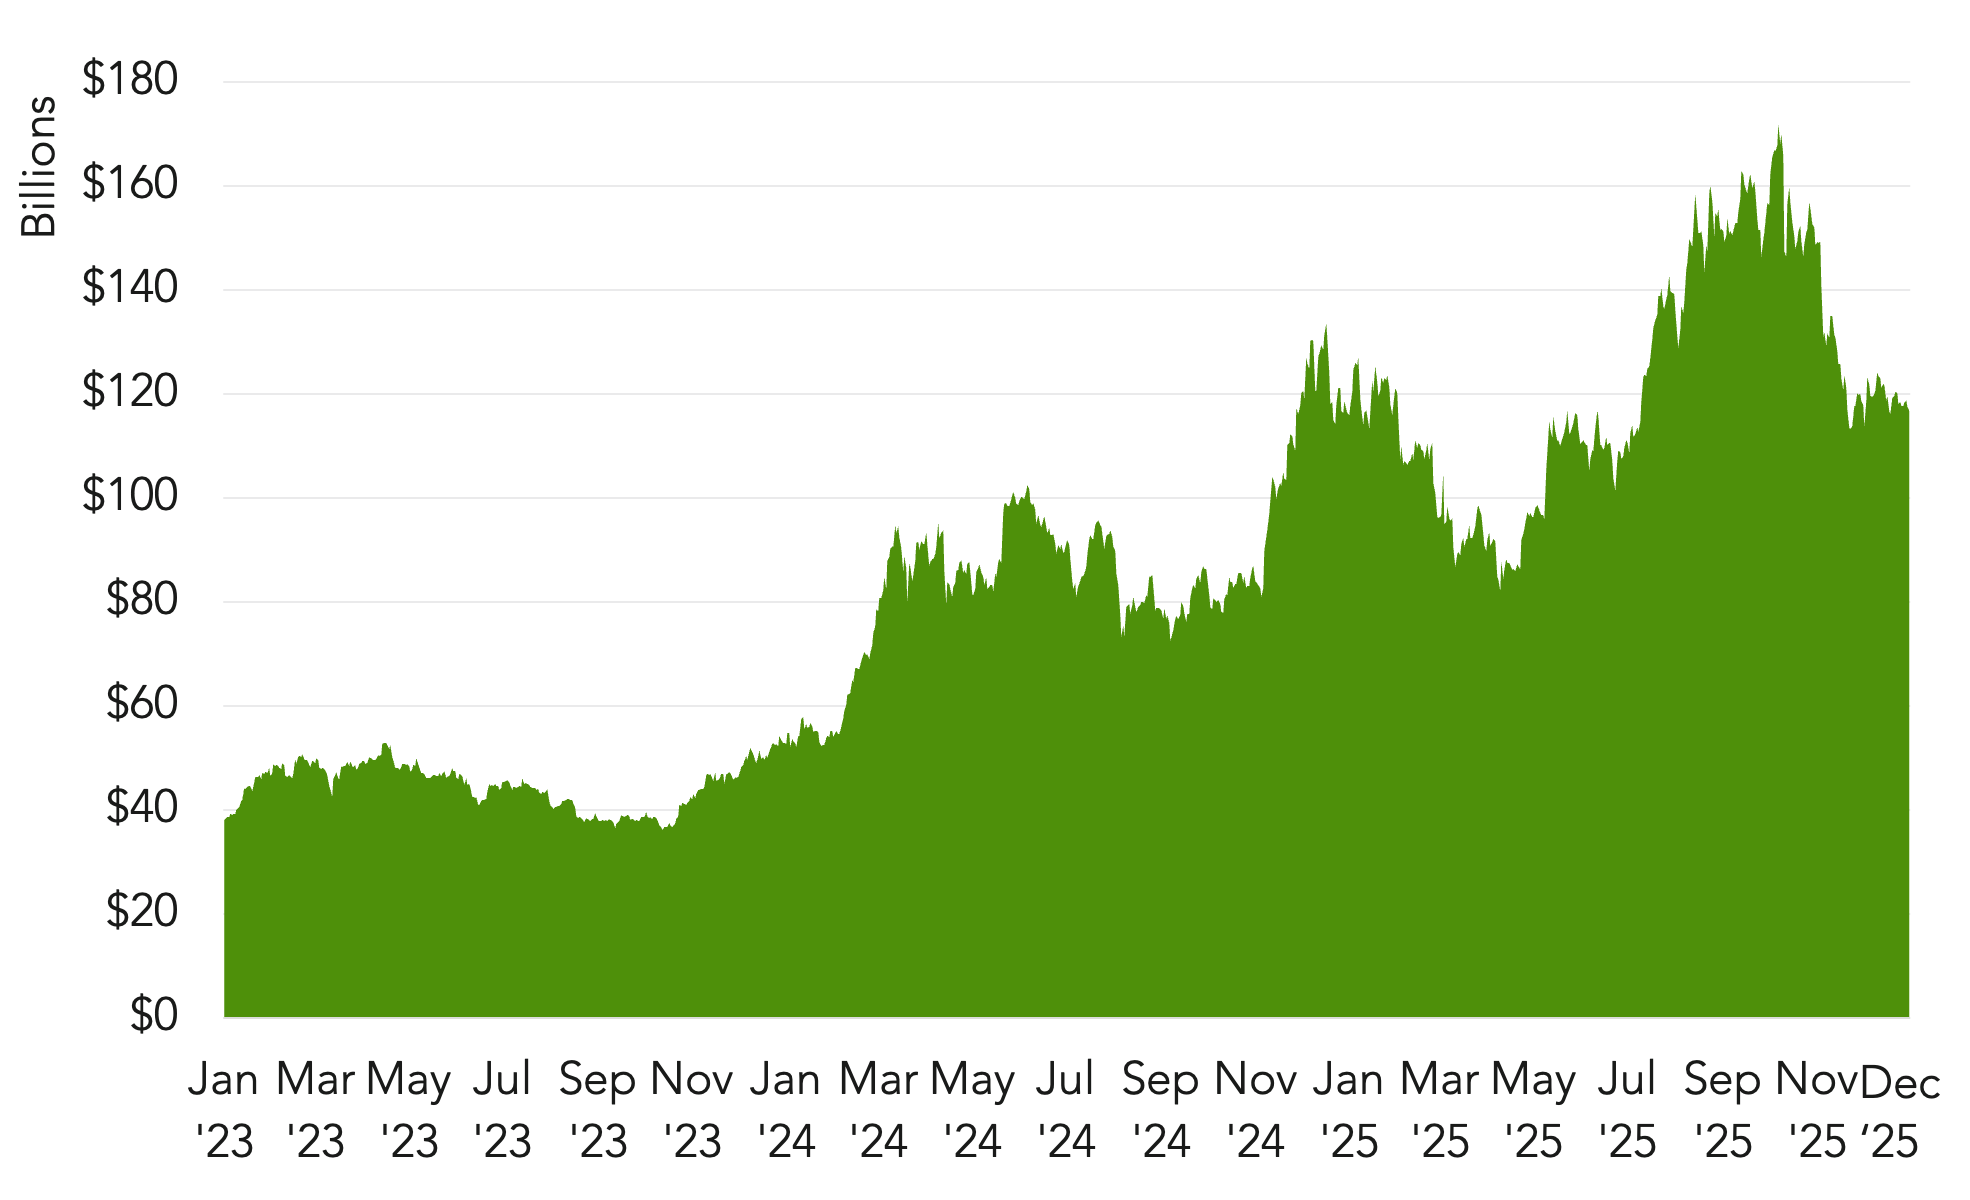
DeFi total value locked (TVL) rose meaningfully over the course of 2025, reflecting continued adoption of decentralized infrastructure despite periods of market volatility. While TVL declined into year-end, the broader trajectory remained firmly higher than prior years, suggesting that capital is increasingly comfortable operating on-chain across market cycles. This pattern highlights DeFi’s growing role as durable financial infrastructure, supported by centralized platforms integrating direct access to on-chain liquidity. The ability of DeFi protocols to retain scale through changing market conditions underscores its maturation within the digital asset ecosystem.
Source: DefiLlama as of December 31, 2025.