
Crypto Seasonality
Like many asset classes, the cryptocurrency market exhibits cyclical trends in price movements, allowing experienced investors to capitalize on such crypto seasonality.
Aug 1, 2023“October. This is one of the peculiarly dangerous months to speculate in stocks. The others are July, January, September, April, November, May, March, June, December, August, and February.”
—Mark Twain (1894)
Historical price movements of cryptocurrencies exhibit patterns that can be leveraged to gain valuable insights for investors and traders. Analyzing historical price data allows investors to uncover recurring patterns that can lead to potential opportunities that arise from the seasonality effect.
Exhibit 1: BTC Monthly Returns
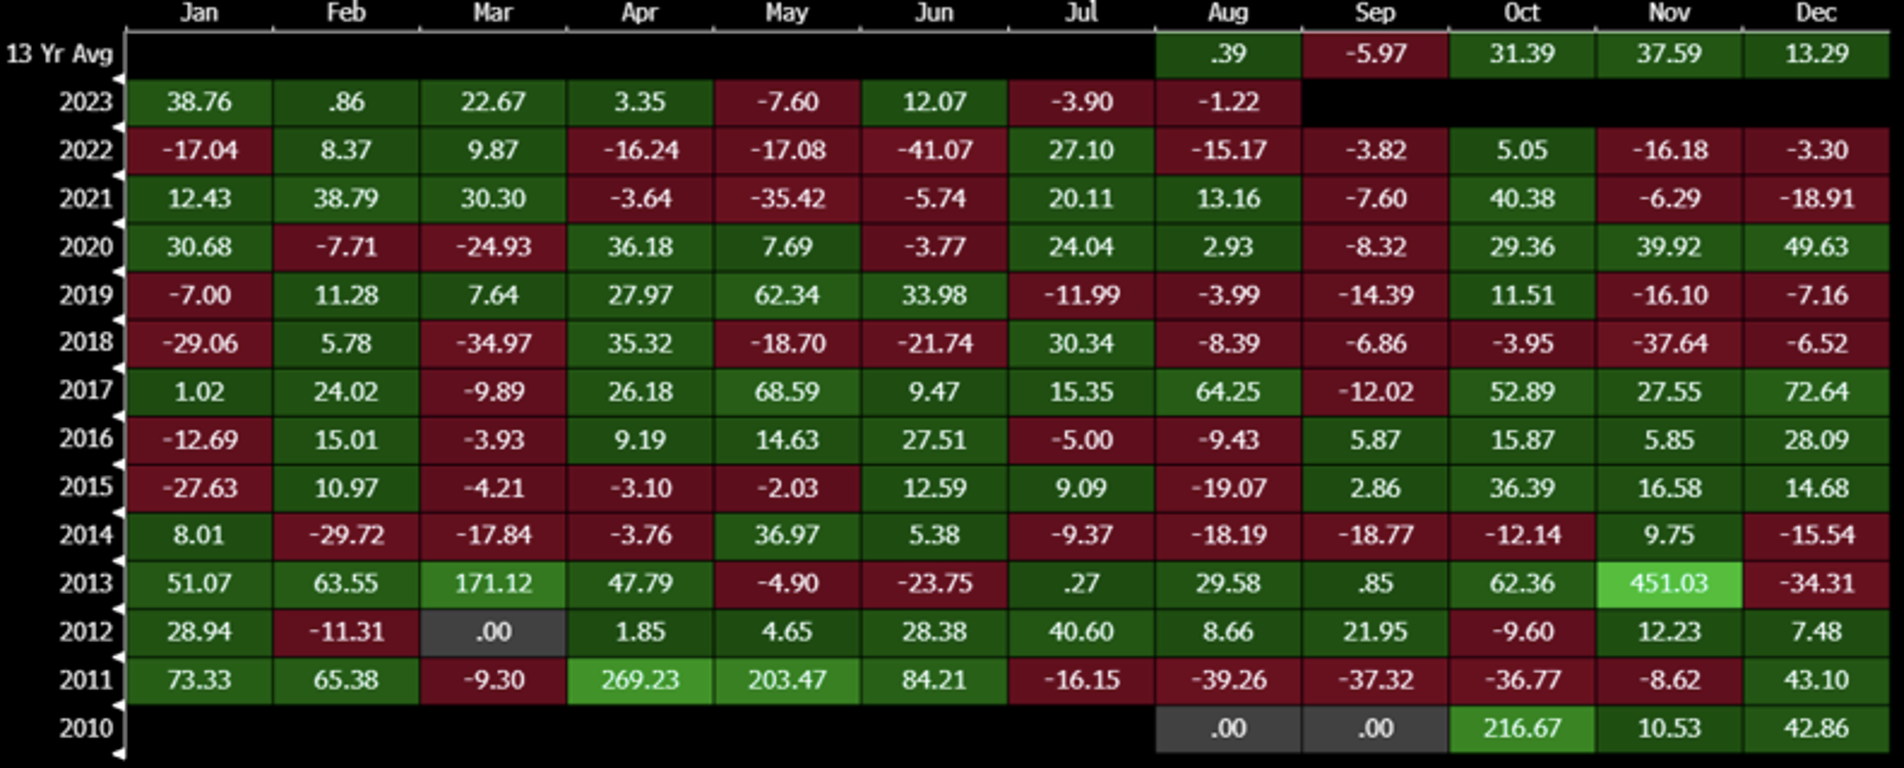
Source: Bloomberg as of August 1, 2023
Exhibit 2: ETH Monthly Returns

Source: Bloomberg as of August 1, 2023
Exhibit 1 and 2 indicate that both ether and bitcoin price movements have a notable momentum effect. For instance, positive price returns followed by another straight month of positive returns, and the tendency for a monthly return to remain in the red for an entire calendar month is less frequent. Cryptocurrency investors have historically seen more profitable periods during February, April to June, and October to December, while March, August, and September tend to show lower median returns or negative growth.
Read on as we explore seasonality of the cryptocurrency market using bitcoin and ether as case studies. We explain the theoretical foundations of the Efficient Market Hypothesis, define market anomalies presented as seasonality effects in the equity market, and provide insights and observations in cryptocurrency and gold.
The Efficient Market Hypothesis
In 1970, Eugene Fama developed the efficient market hypothesis, one of the most widely employed investment theories, which states that share prices reflect all information. He introduced three variants of the theory, each shedding light on different degrees of informational efficiency within financial markets:
Weak Efficient Market Hypothesis: Stock prices incorporate all the available historical information, encompassing the previous evolution of stock prices. Therefore, investors are unable to achieve excess returns based on historical data alone.
Semi-strong Efficient Market Hypothesis: In addition to historical information, stock prices reflect all publicly available financial information. Thus, any attempt to gain abnormal returns by utilizing public information is deemed futile.
Strong Efficient Market Hypothesis: Stock prices fully encompass all information, including historical, public, and non-public (inside) information. This implies that investors, apart from accessing the previously mentioned data, also possess privileged access to unreleased information. Such inside information, also referred to as monopolistic information by Fama, directly influences stock prices.
The American economist Frederic Mishkin supports Fama's Efficient Market Hypothesis, which proposes that stock prices follow a "random walk" pattern, making them inherently unpredictable. Past actions do not provide a basis for forecasting future stock prices, as price changes are considered to be independent and follow the same probability distribution.
Behavioral finance is often discussed in relation to the efficient market hypothesis, which assumes that investors are solely motivated by maximizing profits. However, investors’ cognitive processes and emotions strongly influence their decision-making. These psychological factors can lead to behaviors like loss aversion and increased risk-taking, affecting how they process information and make investment choices. Consequently, individuals may make irrational financial decisions, driven by unwarranted overconfidence or excessive optimism.
Market Anomalies and Seasonality
Market anomalies occur when the performance of securities deviates from the efficient market hypothesis. They come in different forms, some appearing temporarily, while others persist. Leveraging these anomalies can lead to strategies that generate excess returns.
One type of anomaly is seasonal anomalies, like calendar effects, which challenge the weak form of market efficiency. These anomalies indicate that certain recurrent patterns and seasonal tendencies in stock prices allow for informed predictions of future values, suggesting that stock prices are not entirely random and weakening the full application of weak form efficiency.
Let’s dive into seasonality using Invesco QQQ ETF as a case study. Seasonality plays a significant role in forecasting short-term fluctuations in asset prices, particularly during periods of low and stable volatility. It refers to the recurring changes in price levels that occur at specific times within a year, exhibiting a consistent magnitude.
Exhibit 3: Invesco QQQ ETF Monthly Seasonality (Jan 2011 – Jul 2023)

Source: Samara Alpha Management
The January Effect
A well-known deviation from the efficient market hypothesis, the January Effect refers to higher stock returns in January compared to other months. Exhibit 3 shows average positive returns in Januarys. However, the distribution is relatively wide. Three main hypotheses are:
Tax-Loss Selling Hypothesis: Investors engage in tax-loss selling at year-end to minimize taxes, causing temporary stock price depressions. Stock prices bounce back in January, leading to elevated returns.
Historical Origin and Global Impact: The January effect was absent before the introduction of income tax in the US in 1913. However, countries without capital gains taxes, like Japan until 1989 and Canada until 1972, still exhibit signs of the January Effect, implying alternative factors.
Information Hypothesis: Companies ending their fiscal year in December create uncertainty until January's release of accounting data. This disclosure triggers stock price rebounds, contributing to higher stock returns in January.
The “Sell in May and Go Away” Effect
Exhibit 3 also shows us that equities experienced suboptimal performance during the summertime, reflected as poor returns in Septembers. This adage advises investors to divest their holdings in stocks during May and re-engage in mid-September. Stock returns are anticipated to be lower from May to September in comparison to other months throughout the year. This occurrence is believed to stem from a diminished presence of market participants during the warm summer months and holiday periods, which impacts the dynamics of the market.
The October Effect
Also known as the Mark Twain Effect, the October Effect refers to the phenomenon of lower stock returns in October compared to other months. QQQ does not exhibit a clear October Effect. This anomaly is believed to be driven by psychological factors. Investors may feel more anxious and cautious during October because of the historical instances of market crashes happening during this month, which could potentially impact their behavior and investment decisions.
The Santa Clause Effect
During the holiday season, there is generally a sense of optimism and positive sentiment among investors. Exhibit 3 shows a large positive skew with a zero mean. This positive mood can translate into increased buying activity in the stock market, leading to higher stock prices. Here are other possible explanations:
Low Trading Volume: Trading volume tends to be lower during the holiday season as many market participants take time off. With lower trading activity, even small buy orders can have a more significant impact on stock prices, potentially leading to price increases.
Window Dressing: Some fund managers may engage in "window dressing" towards the end of the year. They might buy stocks that have performed well during the year to showcase in their portfolio reports, which can contribute to price appreciation.
Institutional Investment: Institutional investors, such as pension funds and mutual funds, often receive fresh capital at the end of the year from investors contributing to retirement accounts or reallocating their investment portfolios. This influx of capital can lead to increased buying activity in the stock market.
Seasonality in the Cryptocurrency Market
Seasonality in cryptocurrency markets differs from traditional equity markets. In cryptoland, seasonality may be due to market demand dynamics and lack of corporate financial reporting calendar effects. Using gold ETF as an example, a commodity market wherein the commodities involved are non-perishable thus causing seasonal factors to predominantly influence demand dynamics, we provide insights and observations of cryptocurrency seasonality.
Exhibit 4: Gold ETF Monthly Seasonality (Jan 2011 – Jul 2023)

Source: Samara Alpha Management
Exhibit 5: Bitcoin Monthly Seasonality (Jan 2011 – Jul 2023)

Source: Samara Alpha Management
Exhibit 6: Ethereum Monthly Seasonality (Jan 2018 – Jul 2023)

Source: Samara Alpha Management
The January Effect: Gold, bitcoin, and ether returned positive on average in Januarys. Investors may engage in tax loss harvesting – selling digital currency to incur losses and reduce their tax burden or selling digital assets to pay capital gains tax or other tax liabilities.
The “Sell in May and Go Away” Effect: Gold, bitcoin, and ether all suffer significantly in Septembers. The tight distribution of negative returns for cryptocurrency is particularly pronounced, especially for ether. Further, September's negative performance can be attributed, in part, to regulatory uncertainty, with US regulators often delaying significant actions until the end of summer recess.
The October Effect: October is a good month for both bitcoin and ether on average and flat for gold.
The Santa Claus Effect: Gold, bitcoin, and ether show positive returns in December with a right skew in return distribution, especially for bitcoin. Unlike gold, the Chinese Lunar New Year in January/February are particularly good months for bitcoin and ether with relatively tight distribution. The evidence of a ‘Chinese Lunar New Year Effect’ is likely stronger than ‘Santa Claus Effect’.
The data also indicates that the months with high median returns have greater volatility in their price movements, as evidenced in the wide distribution of the bar plots. For instance, BTC-USD experiences heightened volatility during specific periods, namely the summer months (June, July, August) and the winter months (December, January, February). These seasons tend to be characterized by increased price fluctuations and market activity. Among the months that have been more profitable for Bitcoin traders are April, May, October, and November. These months show higher median returns and greater volatility compared to others. Notably, April's returns have been positive in seven out of nine years, with minimal losses in the remaining years.
Are Crypto and Equity Markets Correlated?
Over the past few years, the correlation between equity and crypto markets has been notably strong. However, this interrelation is not solely a result of a self-enforcing correlation, but rather stems from the fact that both US equities and cryptocurrencies historically, and even to this day, draw substantial demand from similar sources, mainly retail and retail-adjacent buyers. Notwithstanding, this correlation broke down post the Luna-Terra collapse of May 2022. Cryptocurrency markets currently have relatively low correlation as regulatory idiosyncratic effects dominate the price movement.
Leveraging Crypto Seasonality
It is important to note that seasonality in cryptocurrency markets is not yet as predictable as it is in the more mature stocks and commodities markets. As technologies evolve and regulatory frameworks become further established, the currently observed trends of crypto seasonality are subject to change.
Samara Alpha Management aims to strategically capitalize on observed trends of crypto seasonality while implementing a resilient approach to endure potential drastic changes in these patterns. Acknowledging the inherent unpredictability of market prices, as proposed by Fama’s Efficient Market Hypothesis, as well as recognizing the potential influence of novel factors on seasonality in the evolving cryptocurrency markets, Samara Alpha Management adopts a cautious and well-informed approach to digital assets.