
When Convexity Dominates Market Structure
How IBIT-linked structured products amplified convexity and nonlinear price responses amid constrained market liquidity during the February 2026 bitcoin selloff.
Feb 9, 2026(Convexity Model and Appendix with month-end retrospective contributed Mar 6, 2026.)
Bitcoin’s sharp selloff in early February 2026 was not caused by any single product or market participant. Rather, it emerged from the interaction of a macro-driven risk-off shock, materially impaired spot liquidity, sustained ETF outflows, and derivatives positioning that magnified price movements. Within this framework, IBIT, the largest U.S. spot bitcoin ETF, played a distinctive role as a transmission and amplification channel, particularly given its growing use as a reference underlier for bank-issued structured notes.
The purpose of this article is not to argue that IBIT or IBIT-linked structured notes caused the drawdown. Rather, it shows that these instruments plausibly increased convexity and nonlinearity in market dynamics at a moment when liquidity was already thin. Under such conditions, even modest incremental hedging flows can exert outsized influence on prices.
Anatomy of the February 2026 Dislocation
In the first week of February 2026, bitcoin experienced a rapid drawdown widely described by market participants as capitulation-like. The episode featured a sharp one-day decline, widespread forced liquidations across leveraged venues, and a powerful rebound that left the market structurally fragile.
Figure 1: 2026 BTC Price Action
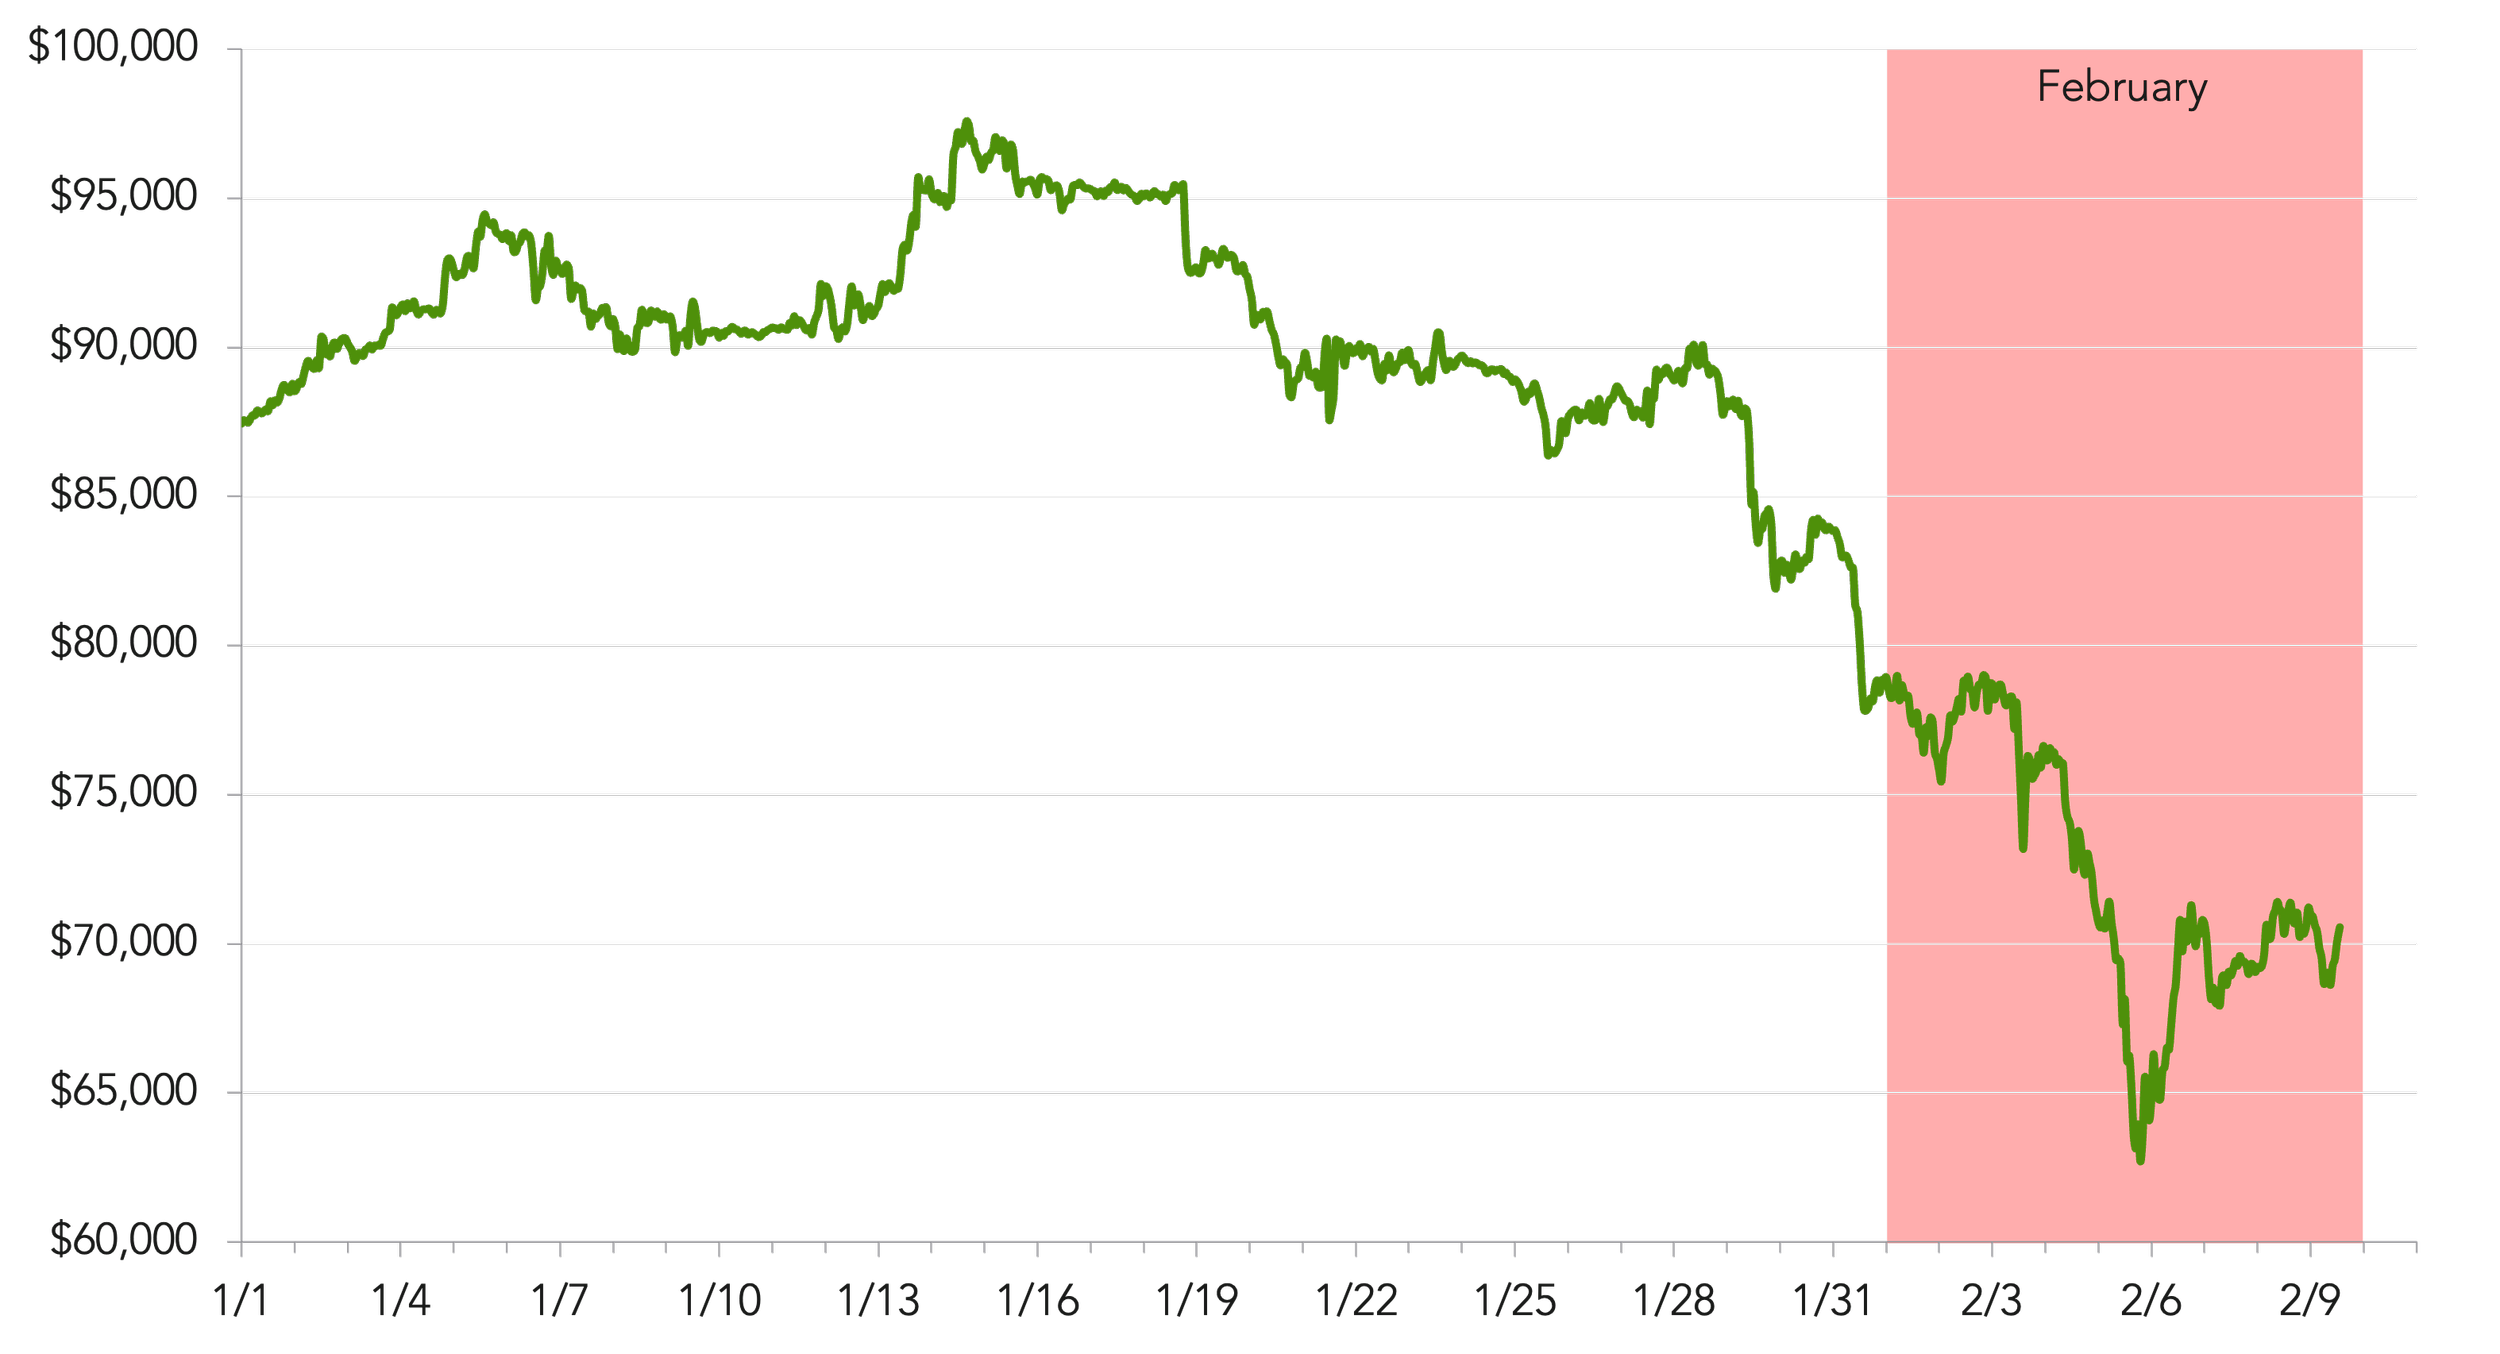
Source: Samara Alpha Management and CoinMarketCap as of February 9, 2026.
On February 5, 2026, bitcoin fell to an intraday low near \$60,000, down roughly 14.8% on the day, its largest single-day decline since November 2022. CoinGlass data cited by Reuters indicated approximately \$1 billion in bitcoin liquidations over a 24-hour period. Reuters framed the move primarily as a macro risk-off event, noting concurrent weakness in technology equities and precious metals, as well as investor unease around monetary policy expectations following reports of potential changes in Federal Reserve leadership.[1]
Flows were a meaningful part of the backdrop. Reuters quoted a Deutsche Bank note emphasizing institutional ETF withdrawals and reported that U.S. spot bitcoin ETFs experienced more than \$3 billion in outflows in January 2026, following approximately \$2 billion in December and \$7 billion in November. These figures indicate that de-risking pressure was well established prior to the February selloff, leaving the market more vulnerable to exogenous shocks.
On February 6, bitcoin rebounded sharply, rising back above \$70,000, in what Reuters described as the largest daily gain since March 2023. Despite the rebound, derivatives markets continued to signal stress. Options data showed heavy demand for downside protection, with positioning concentrated in the \$60,000–$50,000 strike range into the February 27 expiry.
By February 7, Reuters’ follow-up coverage underscored liquidity fragility as a key vulnerability.[2] A Kaiko analyst noted that bitcoin’s average 1% market depth had declined from over \$8 million in 2025 to roughly \$5 million, a deterioration sufficient to transform routine selling into exaggerated price moves.
Why IBIT Became a Transmission Channel
A defining difference between earlier crypto drawdowns and February 2026 was the market’s deeper integration with ETF trading rails, and IBIT’s emergence as the dominant venue for spot bitcoin exposure in public markets.
As of February 6, 2026, IBIT reported approximately \$53.5 billion in net assets, more than 1.34 billion shares outstanding, and a closing price of \$39.93. These figures underscore that IBIT had become the primary liquidity conduit between traditional capital markets and bitcoin spot exposure. While this liquidity is beneficial in normal conditions, during periods of stress it can turn the ETF into a fast exit route, concentrating selling pressure into a single channel.
Figure 2: IBIT Daily Net Flows vs Close Price
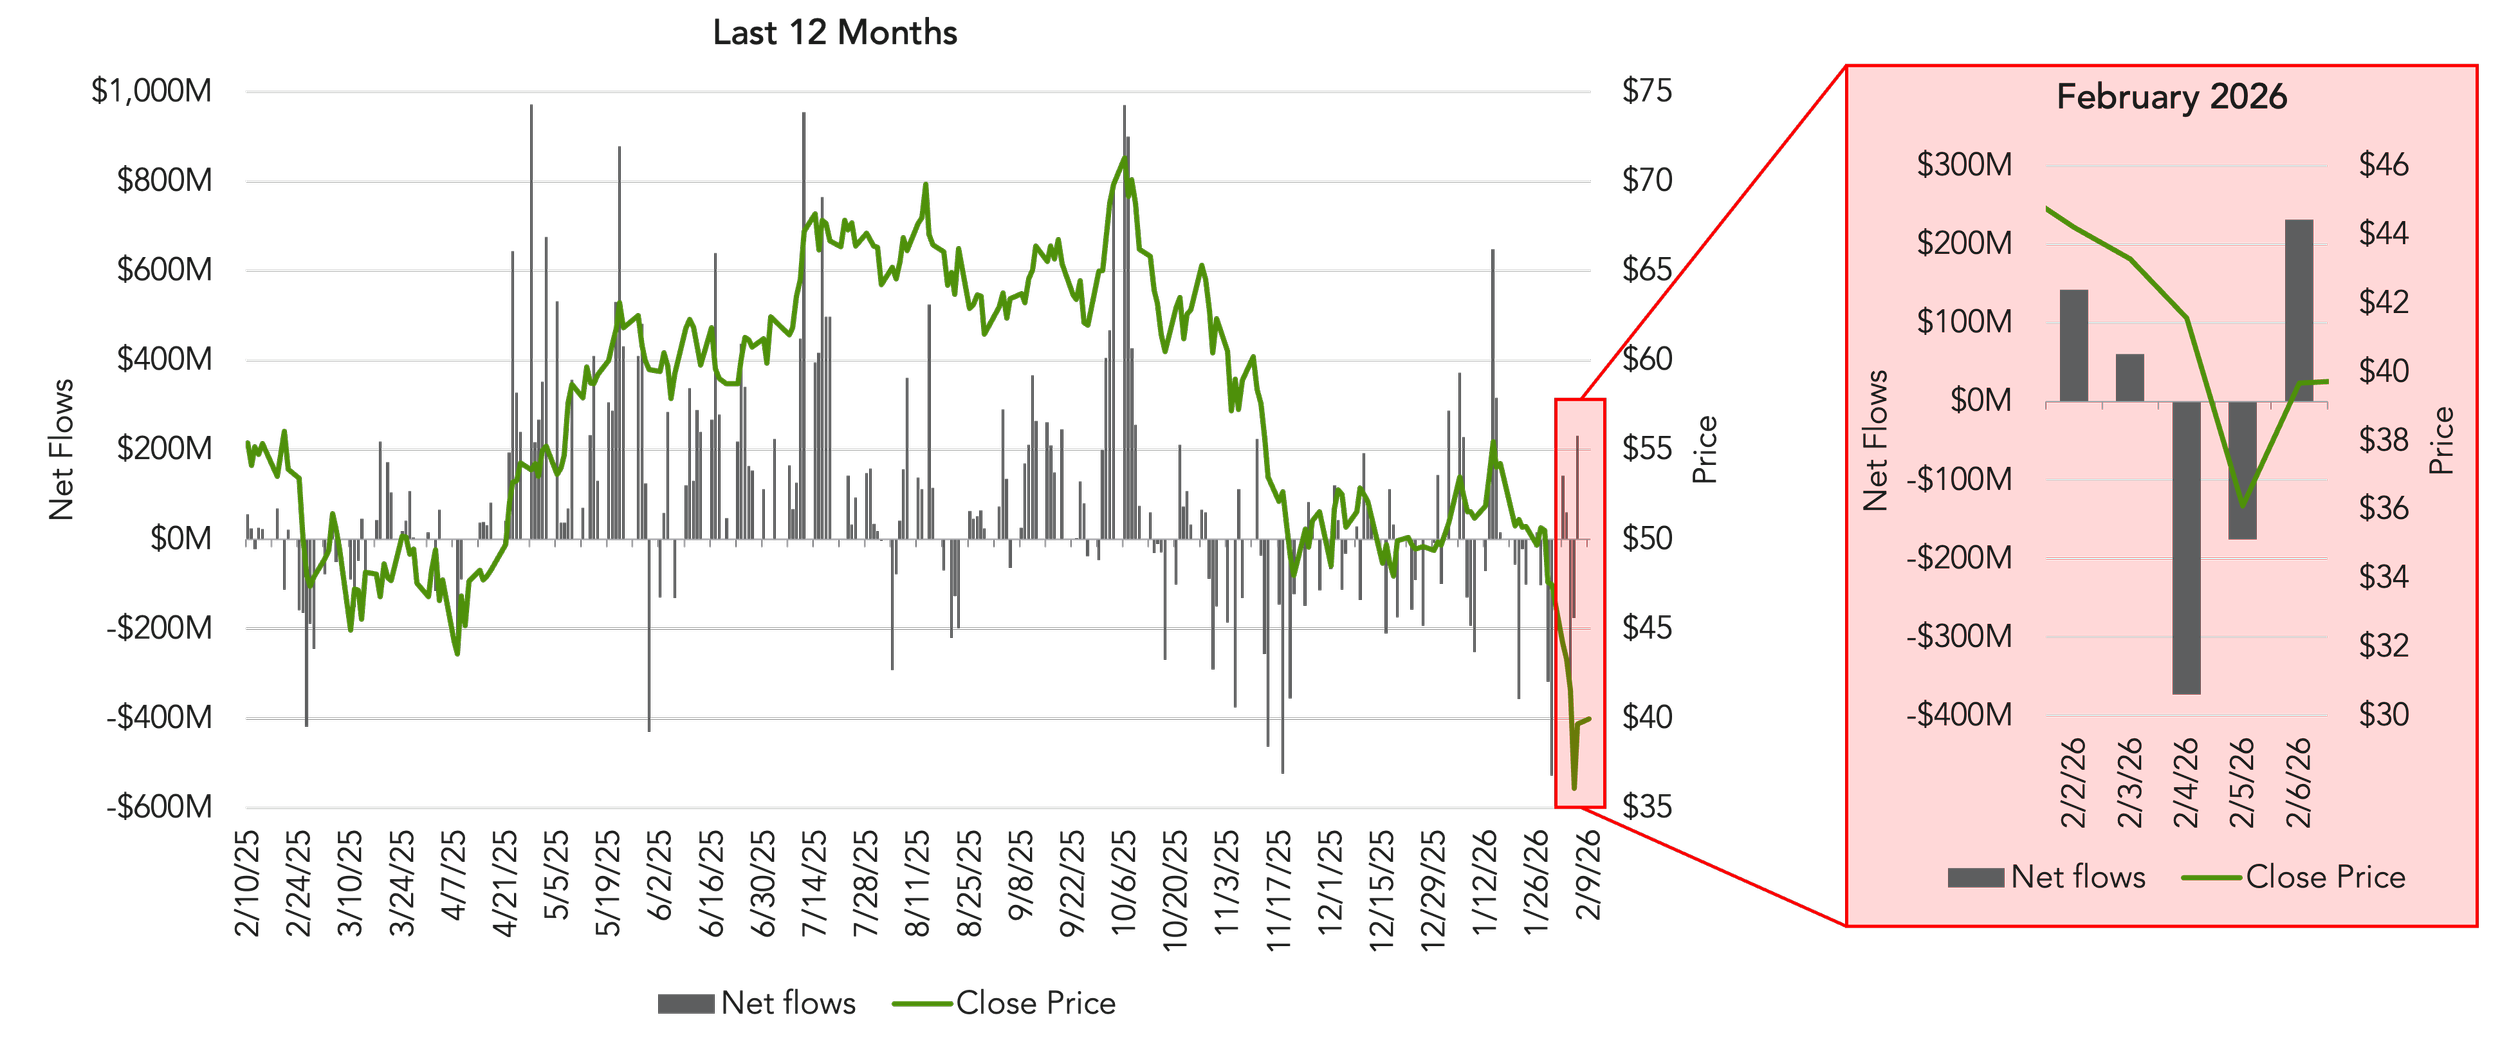
Source: Samara Alpha Management and iShares Bitcoin Trust ETF as of February 9, 2026.
In February 2026, three shocks converged simultaneously:
A macro shock driven by liquidity concerns;
A liquidity shock reflected in shallow order books; and
A flow shock stemming from sustained ETF outflows.
Once selling accelerated through the ETF channel, downstream markets—spot, futures, options, and dealer hedges—were forced to reprice rapidly, often in a nonlinear manner.
The IBIT-Linked Structured Note Stack
The novel development throughout 2025 and 2026 was not the existence of structured notes per se, but the standardization of IBIT as a reference underlier for those products. Multiple major dealers began issuing autocallables, contingent income notes, and barrier-based structures explicitly linked to IBIT and distributing them through U.S. wealth-management channels.
Figure 3: Representative IBIT-Linked Structures
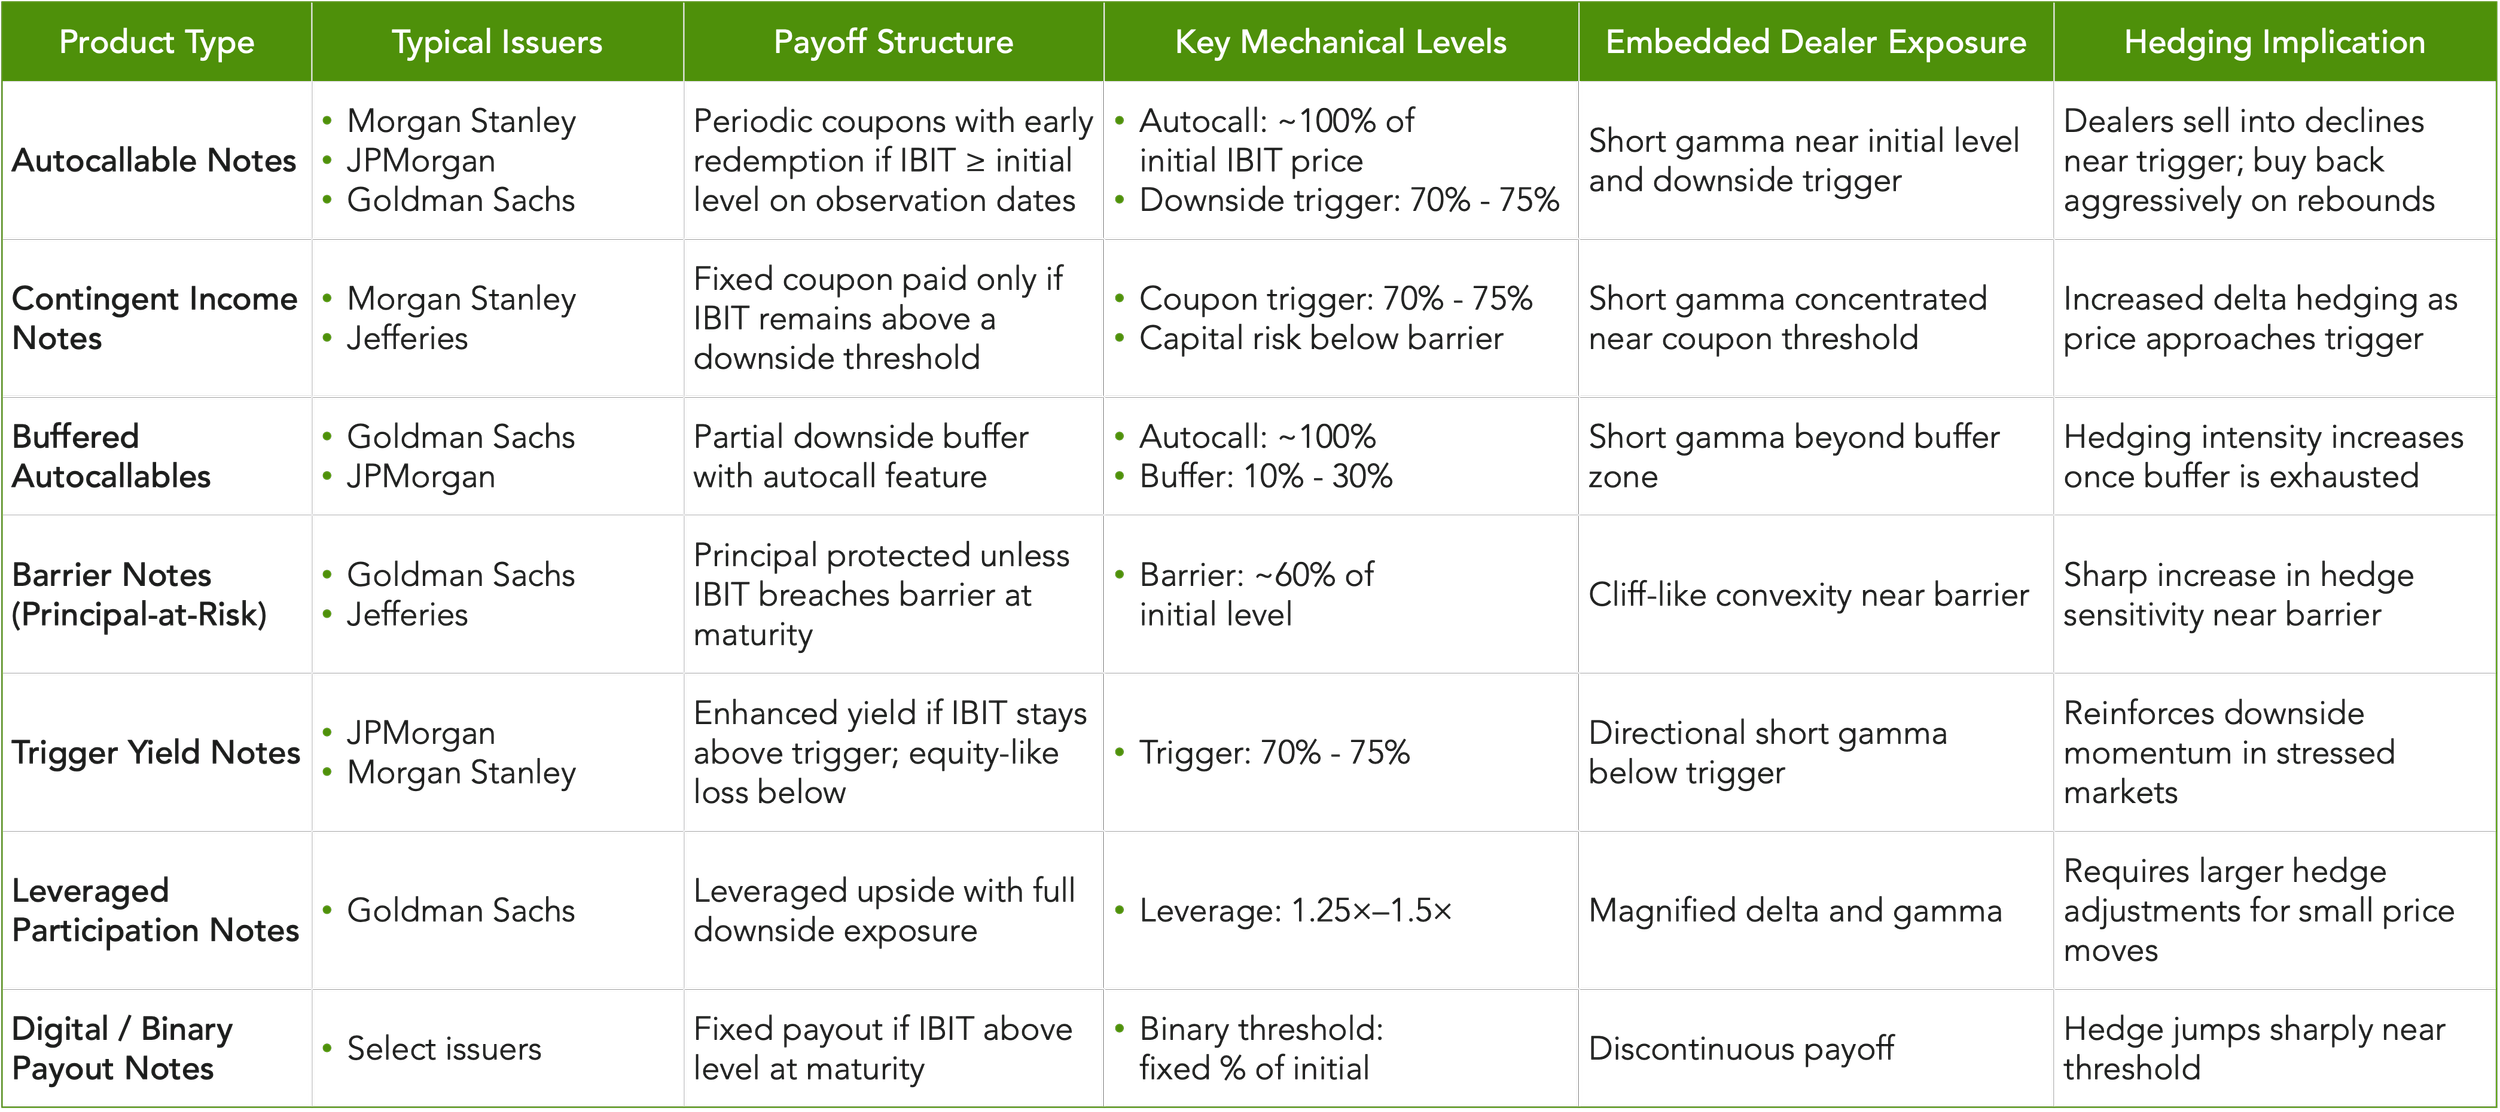
Source: Samara Alpha Management.
Across the products highlighted in Figure 3, risk is concentrated around common trigger levels, with most structures clustering exposure at approximately 70–75% of the initial IBIT price, creating synchronized hedging responses. The embedded convexity is asymmetric: downside hedging accelerates declines, while upside hedging accelerates rebounds. In this framework, notional size understates market influence, as gamma concentration—rather than issuance volume—is what ultimately matters. Because these structures are ETF-centric, most hedging flows pass through IBIT shares, IBIT options, or BTC futures, propagating stress across markets.
By late 2025, issuance had reached a scale that was no longer trivial. Bloomberg reported that Morgan Stanley sold \$104 million of IBIT-linked structured notes in November 2025 alone, five times larger than the next most popular crypto-linked note at the time. A separate Bloomberg report in December 2025 noted that dealers, including Goldman Sachs, JPMorgan, and Jefferies, had collectively sold more than \$530 million of IBIT-linked notes since July. Industry datasets corroborated the breadth of activity, recording more than 100 IBIT-linked issuances and several hundred million dollars of traded notional.
A conservative synthesis of available data suggests that approximately \$250–$300 million of IBIT-linked structured note notional was plausibly outstanding entering February 2026, with higher figures possible depending on assumptions regarding dealer inventory and partial placements.
Embedded Convexity and Dealer Hedging Dynamics
The defining feature of IBIT-linked structured notes is not their headline notional size, but the nonlinear payoff geometry they embed and the resulting state-dependent hedging behavior imposed on dealers. These products concentrate exposure around a small number of mechanically repeated price levels, creating regions in which marginal price moves can trigger disproportionately large changes in hedge requirements.
Structural Sources of Convexity
IBIT-linked structured notes issued in 2025 and 2026 were typically engineered around a limited set of standardized parameters (see Figure 3):
Autocall thresholds near 100% of the initial IBIT reference price, often observed monthly or quarterly.
Downside trigger or coupon thresholds clustered around 70% to 75% of the initial level.
Capital-at-risk barriers in some structures near 60%, below which principal protection erodes.
Leverage features (commonly 1.25x–1.5x) that increase sensitivity to underlying price movements.
While these levels are discrete in legal payoff definitions, the hedging response is continuous. As the underlying price approaches a cliff, the probability-weighted exposure of the note changes rapidly, forcing dealers to rebalance hedges dynamically. This creates convexity that remains latent in calm markets but becomes active as prices approach critical thresholds.
Short-Gamma Exposure Near Key Levels
From the dealer’s perspective, these structures embed short gamma in regions surrounding autocall and downside trigger levels. As IBIT declines toward a downside threshold, the effective delta of the structured note increases in magnitude, requiring dealers to sell additional exposure to remain hedged.
This gamma is asymmetric. On the downside, falling prices increase hedge demand in the same direction as the market move, reinforcing momentum. On the upside, rebounds can force rapid hedge covering, contributing to sharp snapbacks. This asymmetry is consistent with the February 2026 price pattern: air-pocket declines followed by violent recoveries.
Hedge Instruments and Transmission Paths
Dealers typically hedge IBIT-linked structured notes using a combination of:
IBIT shares, transmitting hedging flows directly into ETF trading;
IBIT options, predominantly puts, where sufficient liquidity exists; and
Bitcoin futures, used as a basis substitute when ETF or options liquidity is constrained.
Each hedge instrument links the structured-note book to a broader market layer. ETF hedging impacts authorized participants and underlying spot flows, options hedging affects implied volatility and skew, and futures hedging feeds directly into derivatives liquidation dynamics. The result is cross-market propagation, not isolated pressure.
Why Modest Notional Can Matter
Even conservative estimates suggest \$250 to $300 million of IBIT-linked structured note notional outstanding entering February 2026. In absolute terms, this is small relative to IBIT’s total assets. However, several amplification factors materially increase its potential market impact:
Effective leverage within the structures magnifies delta changes.
Bitcoin’s high underlying volatility increases gamma sensitivity.
Shallow liquidity in IBIT options and bitcoin spot markets limits absorption capacity.
Trigger clustering causes many notes to respond simultaneously to the same price region.
As a result, marginal hedge flows generated near a trigger can be large relative to available liquidity, particularly during periods of stress.
Cliff Proximity Versus Barrier Breach
An important nuance is that hedging intensity increases well before any formal barrier is breached. While structured-note payoffs are determined on future observation or valuation dates, dealers hedge based on evolving probabilities rather than binary outcomes.
When IBIT trades near a downside threshold, small additional price moves can meaningfully alter the distribution of future payoffs (see Figure 2). This forces dealers to rebalance hedges preemptively, even in the absence of a contractual event. In February 2026, IBIT’s proximity to widely used 75% trigger levels materially increased this sensitivity, heightening the likelihood of reflexive hedging precisely when market depth was weakest.
Interaction with Thin-Liquidity Regimes
These dynamics are largely benign in deep, liquid markets. February 2026, however, was characterized by structurally impaired liquidity, with materially reduced spot depth and defensive positioning in derivatives markets. Under such conditions, hedging flows that would normally be absorbed can instead move the market, creating feedback loops between price declines and hedge rebalancing.
Structured-note convexity does not need to be large in notional terms to be influential; it only needs to be directionally aligned with stress, clustered around common levels, and activated in a thin market. All three conditions were present during the February 2026 selloff.
Net Effect on Price Dynamics
The practical consequence of embedded convexity and dealer hedging is a market that becomes more discontinuous under stress. Downside moves accelerate as hedging reinforces selling pressure, while subsequent rebounds can be equally violent as hedges are unwound. This dynamic helps explain why February 2026 featured both a rapid drawdown and an unusually sharp recovery, without a corresponding improvement in underlying liquidity conditions.
A simplified convexity framework illustrating how these hedging dynamics can generate nonlinear selling pressure as IBIT approaches concentrated barrier levels is presented in the Appendix below.
Amplification in a Thin-Liquidity Regime
Even absent structured-note effects, the market’s capacity to absorb flows in February 2026 was strained. Reuters’ discussion of diminished market depth implies that relatively modest incremental hedging demand could exert disproportionate price impact.
The selloff also occurred amid visible defensive positioning in derivatives markets, with extreme demand for downside protection into late-February expiries. In an environment characterized by ETF outflows, shallow order books, defensive options positioning, and clustered structured-product cliffs, it is analytically reasonable to treat IBIT-linked structured convexity as a volatility amplifier rather than a primary driver.
How IBIT-Linked Convexity Shaped Price Dynamics
The strongest evidence-based conclusion is not that IBIT or IBIT-linked structured notes caused bitcoin’s February 2026 selloff. The dominant forces were macro risk aversion, leverage-driven liquidations, and impaired liquidity. However, IBIT materially influenced the shape and severity of the move by serving as both the principal ETF exit rail and the standardized underlier for structured products embedding discontinuous payoff regions.
When these elements coincide, IBIT becomes a mechanism through which stress propagates rapidly and nonlinearly across the crypto market. In such regimes, IBIT does not originate volatility, but it can meaningfully amplify it.
[1] https://www.reuters.com/business/bitcoin-slumps-with-key-70000-level-sight-2026-02-05/
[2] https://www.reuters.com/business/bitcoin-loses-trump-era-gains-crypto-market-volatility-signals-uncertainty-2026-02-07/
Appendix: Convexity Shock Model and Historical Price Analysis
Contributed by Leyu Zou, Investment Analyst, Samara Alpha Management.
By analyzing the interaction between theoretical dealer hedging models and actual historical price action, we can isolate the mechanical drivers behind the February 5th capitulation, revealing a market driven more by derivatives plumbing than fundamental deterioration.
Model: IBIT Price Drawdown vs. Convexity Shock
See Methodology and Model Assumptions below.
Source: Samara Alpha Management. Source for IBIT shares daily close price: Yahoo Finance as of February 28, 2026.
Note: This is a simplified, continuous-time heuristic model designed to visualize aggregate structural convexity. Real-world dealer flows are highly path-dependent and subject to discrete trading frictions, shifts in the volatility surface (vega and vanna effects), and the specific term structures of individual autocallable notes.
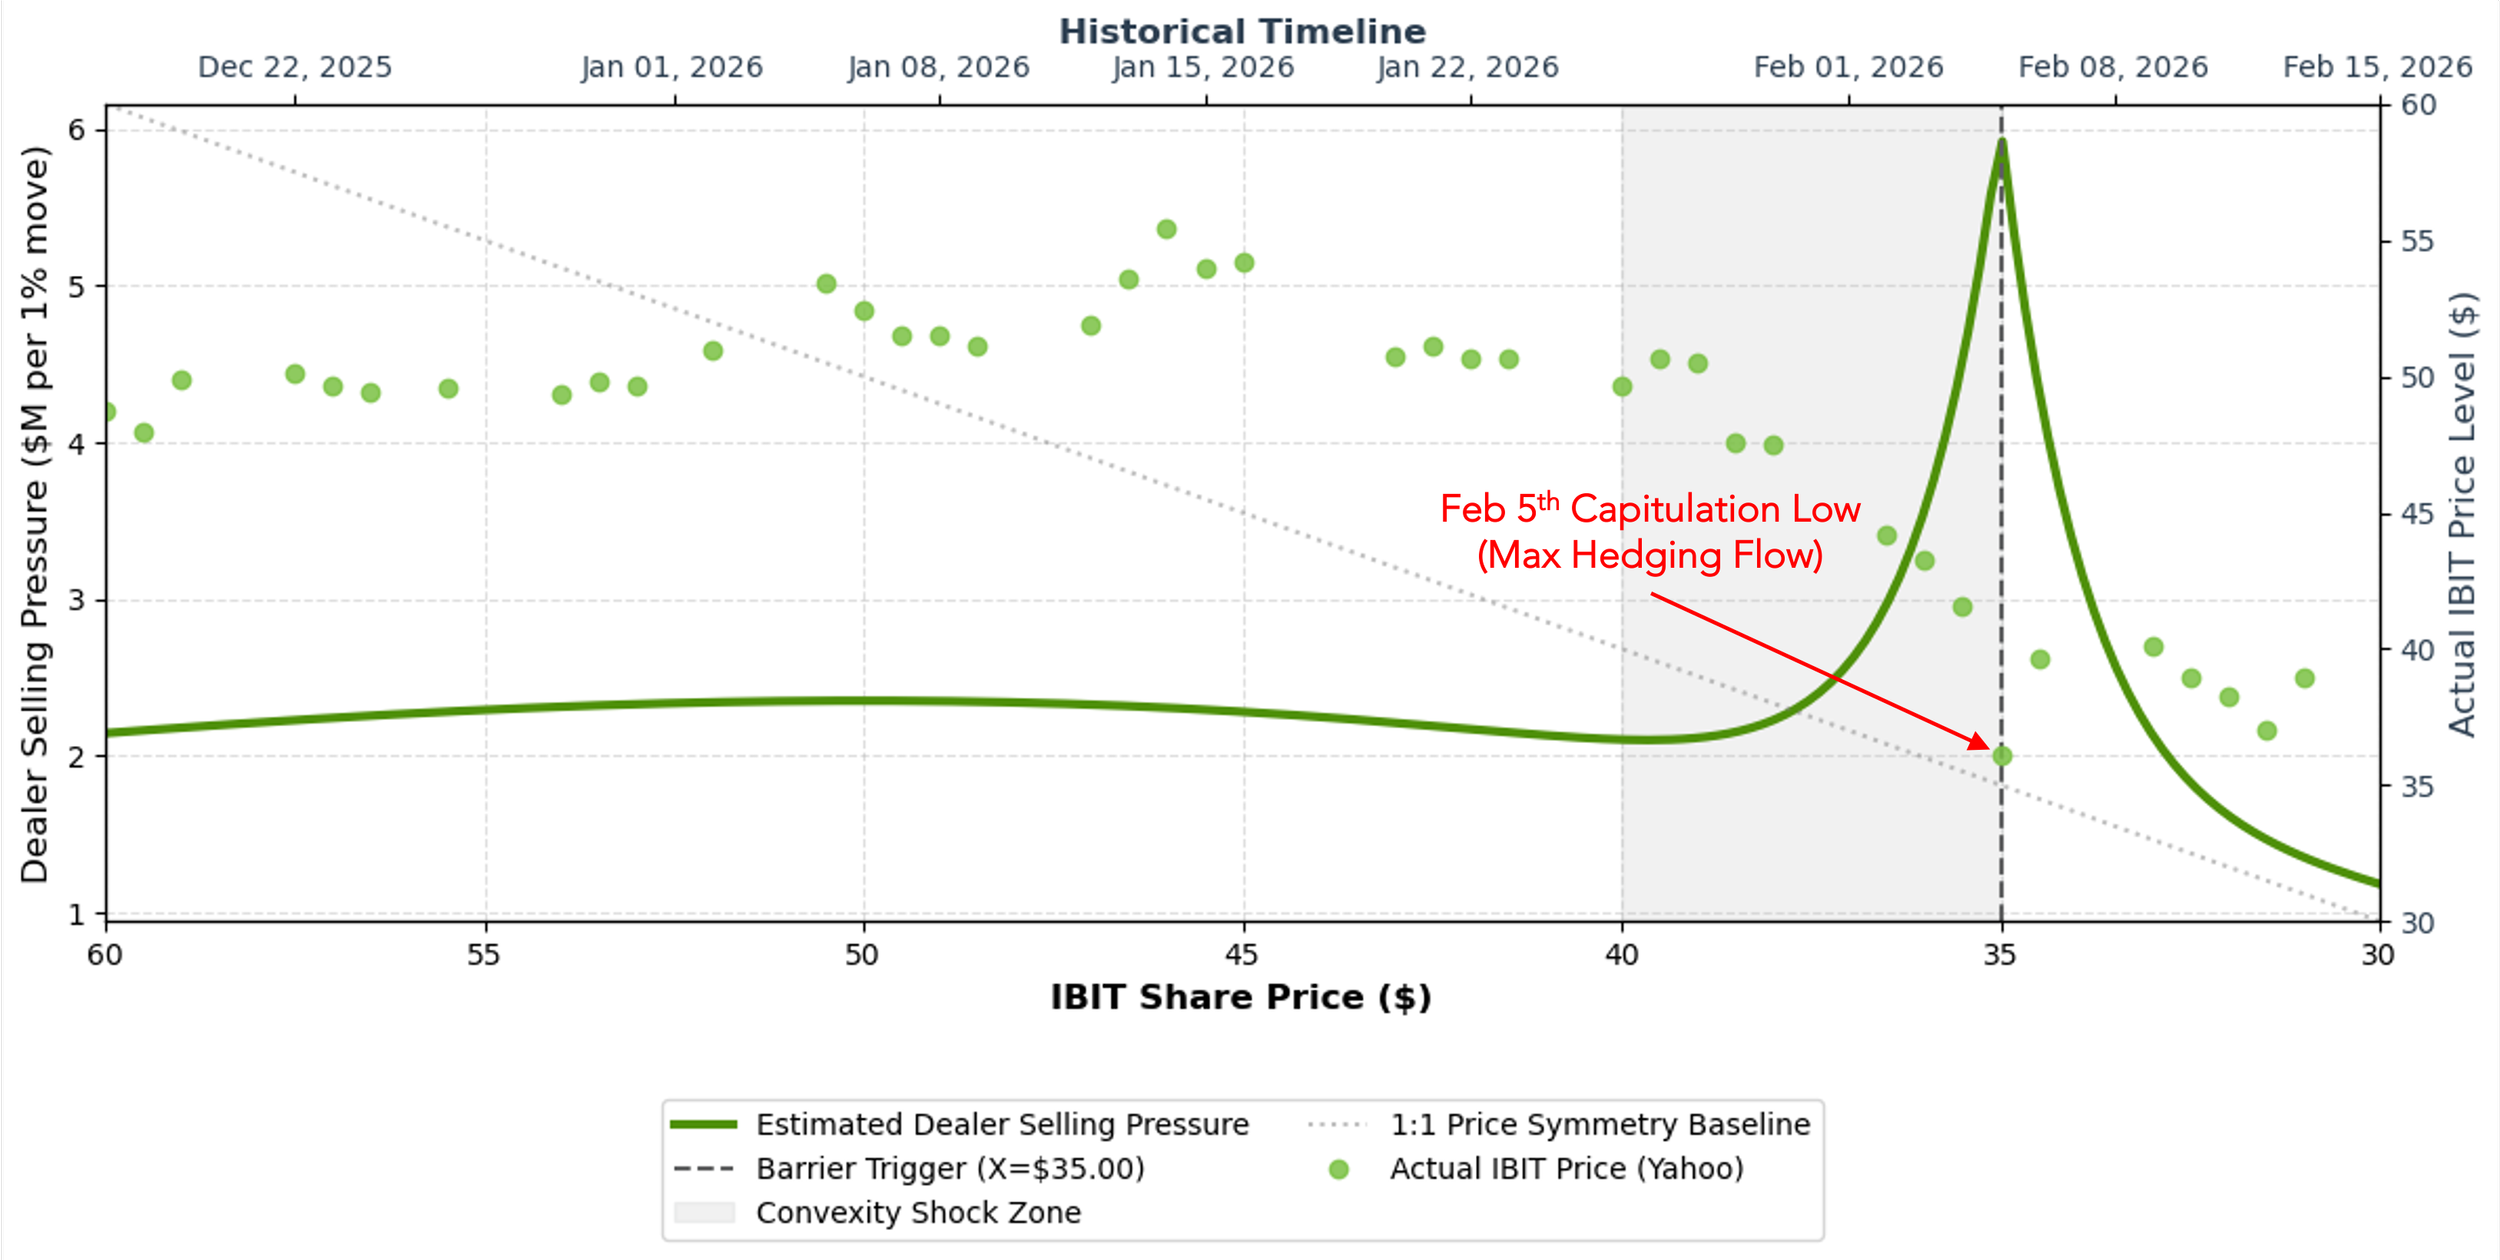
This Convexity Shock Model illustrates the latent risk embedded in the rapid proliferation of IBIT-linked structured notes throughout late 2025. Assuming an average structured note issuance price of \$50.00 with typical downside capital-at-risk barriers clustered near the 70% mark (\$35.00), the model maps the required dealer hedging pressure. In the upper price bounds, the necessary hedging adjustments are linear and easily absorbed. However, as the underlying price descends into the \$35.00 to $40.00 "convexity shock zone," dealer selling pressure grows exponentially. This represents a classic short-gamma trap. Because dealers are on the other side of these trades, they are mechanically forced to sell increasingly larger volumes of IBIT, or its derivatives, into a falling market to remain delta-neutral as the price approaches the critical knock-in barrier.
Historical Price Action: Theory Meets Market Behavior
Historical price action from November 2025 through February 2026 demonstrates this convexity theory in practice. As macro headwinds and sustained institutional ETF outflows initially pushed IBIT lower, the price trajectory inevitably intersected with these structured product tripwires. On February 5th, IBIT plummeted to an intraday capitulation low of roughly \$36.10, nearly reaching the \$35.00 barrier level. This historical low perfectly aligns with the apex of the estimated selling pressure mapped in our convexity model. Dealers were effectively offloading maximum notional volume precisely in this \$36 to $38 window to front-run the potential cliff, exacerbating the localized price collapse before flows exhausted and the market sharply rebounded.
The Volatility Accelerant
The correlation between the structural model and the historical selloff is fully realized when factoring in the behavior of implied volatility. On February 5th, the Bitcoin Volatility Index (BitVol) experienced a severe and sudden expansion, spiking from 1.71% to 2.23%. In the context of barrier options, a volatility spike (vega exposure) is an immediate accelerant. The sudden expansion in implied volatility mathematically widened the probability distribution of IBIT breaching that \$35.00 barrier, regardless of the spot price at that exact second. Consequently, dealers' risk engines forced them to aggressively sell additional IBIT to hedge this increased probability of a breach.
Methodology and Model Assumptions
The estimated dealer selling pressure is derived from a modified Black-Scholes barrier-hedging framework. The model calculates the required delta-hedging flows (short gamma exposure) generated by dealers rebalancing their books as the underlying asset approaches a localized downside knock-in barrier.
Static baseline assumptions:
Estimated outstanding notional (N): \$250,000,000
Initial reference price (S_0 \/K): \$50.00
Barrier trigger level (H): \$35.00 (70% of initial issuance)
Annualized implied volatility (σ): 60%
Time to maturity (T): 0.5 years (6 months)
The hedging flow per 1% move in the underlying spot price is a function of the standard Black-Scholes Gamma (Γ) combined with an exponential barrier-proximity multiplier to simulate the intense, localized liquidity demands near the trigger. Standard Gamma is calculated as:
Γ = ϕ(d_1 )/(Sσ√T)
Where ϕ represents the standard normal probability density function, and d_1 (using a zero-drift approximation for short-term localized stress) is defined as:
d_1 = ln(S/K)/(σ√T)
The localized dealer selling pressure (in nominal dollars per 1% price decline) is then modeled as:
Hedging Flow = (N×Γ)+e^(-0.8(S-H) )×0.05×S×0.01
The chart above provides a visual illustration of how this simplified model translates price movements into estimated hedging flows. It maps the relationship between IBIT’s share price and the model’s estimate of dealer hedging pressure as the ETF approaches a key strike region.
The x-axis shows the IBIT share price in U.S. dollars, while the left y-axis represents the model’s estimated dealer selling pressure, measured as the dollar amount of hedging flow associated with a 1% decline in price. The green curve plots the modeled relationship implied by the equations above. The right y-axis shows the actual IBIT price level, with the green dots representing historical price observations during the February 2026 period.
The vertical dashed line marks the assumed trigger level around \$35, where the model suggests hedging pressure rises most sharply. The shaded region highlights this convexity shock zone, where nonlinear hedging dynamics may intensify as the price approaches concentrated option strikes.